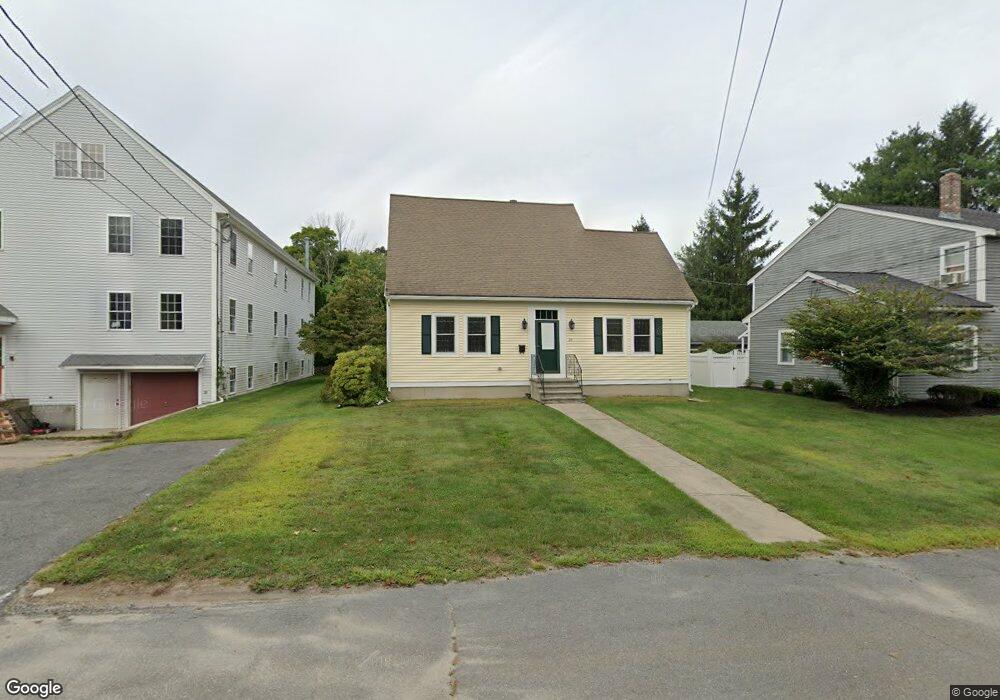
25 Broad St Medway, MA 02053
Estimated Value: $605,051 - $715,000
3
Beds
2
Baths
1,930
Sq Ft
$344/Sq Ft
Est. Value
About This Home
This home is located at 25 Broad St, Medway, MA 02053 and is currently estimated at $663,263, approximately $343 per square foot. 25 Broad St is a home located in Norfolk County with nearby schools including John D. McGovern Elementary School, Burke-Memorial Elementary, and Medway Middle School.
Ownership History
Date
Name
Owned For
Owner Type
Purchase Details
Closed on
May 8, 2024
Sold by
Mitchell Lisa A
Bought by
Lisa A Mitchell Ret and Mitchell
Current Estimated Value
Purchase Details
Closed on
Feb 2, 1993
Sold by
Pilkington Susan M
Bought by
Mitchell Lisa A
Home Financials for this Owner
Home Financials are based on the most recent Mortgage that was taken out on this home.
Original Mortgage
$101,600
Interest Rate
8.16%
Mortgage Type
Purchase Money Mortgage
Create a Home Valuation Report for This Property
The Home Valuation Report is an in-depth analysis detailing your home's value as well as a comparison with similar homes in the area
Home Values in the Area
Average Home Value in this Area
Purchase History
| Date | Buyer | Sale Price | Title Company |
|---|---|---|---|
| Lisa A Mitchell Ret | -- | None Available | |
| Lisa A Mitchell Ret | -- | None Available | |
| Mitchell Lisa A | $127,000 | -- | |
| Mitchell Lisa A | $127,000 | -- |
Source: Public Records
Mortgage History
| Date | Status | Borrower | Loan Amount |
|---|---|---|---|
| Previous Owner | Mitchell Lisa A | $95,000 | |
| Previous Owner | Mitchell Lisa A | $101,600 |
Source: Public Records
Tax History Compared to Growth
Tax History
| Year | Tax Paid | Tax Assessment Tax Assessment Total Assessment is a certain percentage of the fair market value that is determined by local assessors to be the total taxable value of land and additions on the property. | Land | Improvement |
|---|---|---|---|---|
| 2025 | $7,158 | $502,300 | $259,200 | $243,100 |
| 2024 | $7,233 | $502,300 | $259,200 | $243,100 |
| 2023 | $7,127 | $447,100 | $223,300 | $223,800 |
| 2022 | $7,148 | $422,200 | $199,400 | $222,800 |
| 2021 | $6,731 | $385,500 | $179,400 | $206,100 |
| 2020 | $6,332 | $361,800 | $159,500 | $202,300 |
| 2019 | $6,140 | $361,800 | $159,500 | $202,300 |
| 2018 | $6,204 | $351,300 | $139,500 | $211,800 |
| 2017 | $5,661 | $315,900 | $110,100 | $205,800 |
| 2016 | $5,649 | $311,900 | $106,100 | $205,800 |
| 2015 | $5,428 | $297,600 | $100,000 | $197,600 |
| 2014 | $5,401 | $286,700 | $105,100 | $181,600 |
Source: Public Records
Map
Nearby Homes
- 20 Broad St Unit 6
- 20 Broad St Unit A
- 20 Broad St Unit 4
- 9 Sanford St
- 14 Sanford St Unit 15
- 841 Lincoln St
- 56 Fuller Place
- 50 Main St
- 7 Gloucester Dr
- 2 Skyline Dr
- 16 Lexington Ln
- 280 Village St Unit D2
- 0 Elm St
- 3 Meryl St
- 4 Shaw St
- 22 Sunset Dr
- 732 Lincoln St
- 24 Shayne Rd Unit 219
- 106 Holliston St
- 12 Lovering St