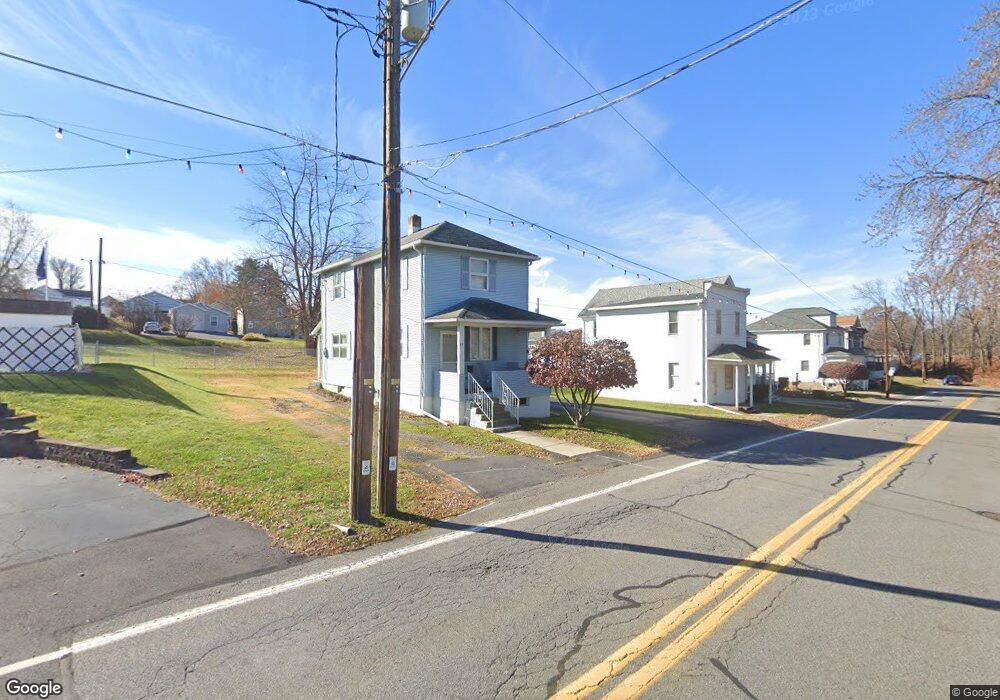
25 Bryden St Pittston, PA 18640
Estimated Value: $122,000 - $160,000
Studio
--
Bath
960
Sq Ft
$141/Sq Ft
Est. Value
About This Home
This home is located at 25 Bryden St, Pittston, PA 18640 and is currently estimated at $135,465, approximately $141 per square foot. 25 Bryden St is a home located in Luzerne County with nearby schools including Pittston City Intermediate Center, Pittston Area Middle School, and Pittston Area Senior High School.
Ownership History
Date
Name
Owned For
Owner Type
Purchase Details
Closed on
Mar 16, 2023
Sold by
Defrancesco Angelo
Bought by
Tanona Damon Lee and Connors Kaitlyn Melissa
Current Estimated Value
Home Financials for this Owner
Home Financials are based on the most recent Mortgage that was taken out on this home.
Original Mortgage
$33,750
Outstanding Balance
$30,998
Interest Rate
6.12%
Mortgage Type
New Conventional
Estimated Equity
$104,467
Purchase Details
Closed on
Jan 20, 1981
Bought by
Defrancesco Angelo
Create a Home Valuation Report for This Property
The Home Valuation Report is an in-depth analysis detailing your home's value as well as a comparison with similar homes in the area
Home Values in the Area
Average Home Value in this Area
Purchase History
| Date | Buyer | Sale Price | Title Company |
|---|---|---|---|
| Tanona Damon Lee | $45,000 | -- | |
| Defrancesco Angelo | $12,000 | -- |
Source: Public Records
Mortgage History
| Date | Status | Borrower | Loan Amount |
|---|---|---|---|
| Open | Tanona Damon Lee | $33,750 |
Source: Public Records
Tax History
| Year | Tax Paid | Tax Assessment Tax Assessment Total Assessment is a certain percentage of the fair market value that is determined by local assessors to be the total taxable value of land and additions on the property. | Land | Improvement |
|---|---|---|---|---|
| 2026 | $1,513 | $60,800 | $27,200 | $33,600 |
| 2025 | $1,508 | $60,800 | $27,200 | $33,600 |
| 2024 | $1,483 | $60,800 | $27,200 | $33,600 |
| 2023 | $1,483 | $60,800 | $27,200 | $33,600 |
| 2022 | $1,442 | $60,800 | $27,200 | $33,600 |
| 2021 | $1,426 | $60,800 | $27,200 | $33,600 |
| 2020 | $1,392 | $60,800 | $27,200 | $33,600 |
| 2019 | $1,381 | $60,800 | $27,200 | $33,600 |
| 2018 | $1,335 | $60,800 | $27,200 | $33,600 |
| 2017 | $1,304 | $60,800 | $27,200 | $33,600 |
| 2016 | -- | $60,800 | $27,200 | $33,600 |
| 2015 | $973 | $60,800 | $27,200 | $33,600 |
| 2014 | $973 | $60,800 | $27,200 | $33,600 |
Source: Public Records
Map
Nearby Homes
Your Personal Tour Guide
Ask me questions while you tour the home.