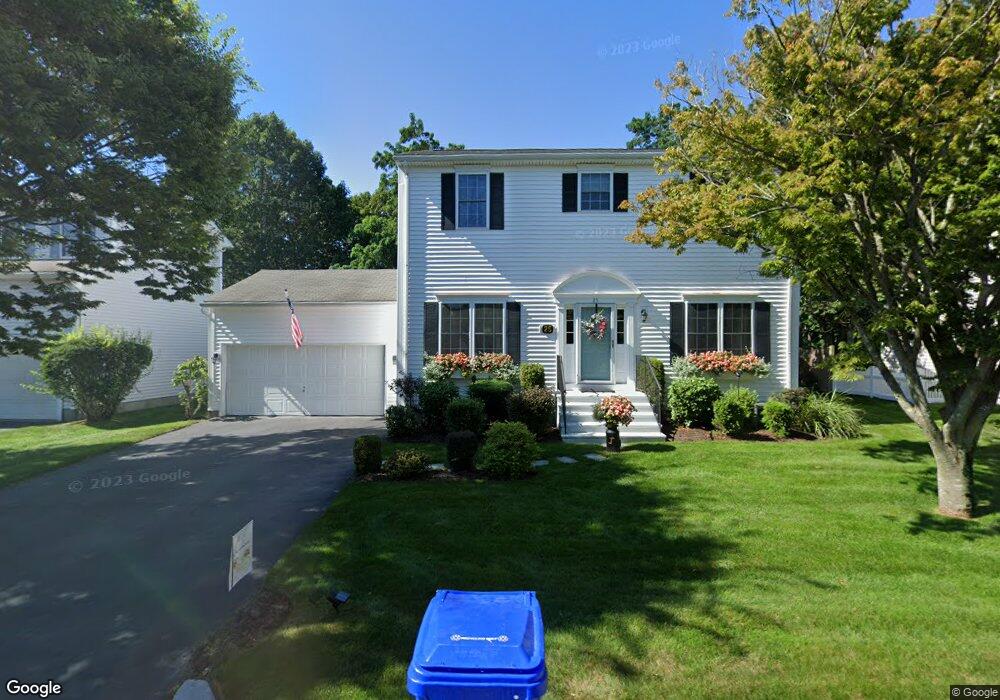
25 Carousel Dr Riverside, RI 02915
Riverside NeighborhoodEstimated Value: $624,000 - $736,000
3
Beds
3
Baths
1,780
Sq Ft
$388/Sq Ft
Est. Value
About This Home
This home is located at 25 Carousel Dr, Riverside, RI 02915 and is currently estimated at $691,006, approximately $388 per square foot. 25 Carousel Dr is a home located in Providence County with nearby schools including East Providence High School, St Luke Elementary School, and St Mary Academy-Bay View.
Ownership History
Date
Name
Owned For
Owner Type
Purchase Details
Closed on
Dec 20, 2001
Sold by
Jgp Builders Inc
Bought by
Traverse Stanley R and Traverse Barbara
Current Estimated Value
Home Financials for this Owner
Home Financials are based on the most recent Mortgage that was taken out on this home.
Original Mortgage
$50,000
Outstanding Balance
$19,494
Interest Rate
6.54%
Mortgage Type
Purchase Money Mortgage
Estimated Equity
$671,512
Create a Home Valuation Report for This Property
The Home Valuation Report is an in-depth analysis detailing your home's value as well as a comparison with similar homes in the area
Home Values in the Area
Average Home Value in this Area
Purchase History
| Date | Buyer | Sale Price | Title Company |
|---|---|---|---|
| Traverse Stanley R | $272,000 | -- | |
| Traverse Stanley R | $272,000 | -- |
Source: Public Records
Mortgage History
| Date | Status | Borrower | Loan Amount |
|---|---|---|---|
| Open | Traverse Stanley R | $20,000 | |
| Closed | Traverse Stanley R | $30,000 | |
| Open | Traverse Stanley R | $50,000 | |
| Closed | Traverse Stanley R | $50,000 |
Source: Public Records
Tax History
| Year | Tax Paid | Tax Assessment Tax Assessment Total Assessment is a certain percentage of the fair market value that is determined by local assessors to be the total taxable value of land and additions on the property. | Land | Improvement |
|---|---|---|---|---|
| 2025 | $9,009 | $689,300 | $315,600 | $373,700 |
| 2024 | $8,527 | $556,200 | $263,000 | $293,200 |
| 2023 | $8,210 | $556,200 | $263,000 | $293,200 |
| 2022 | $8,984 | $411,000 | $175,100 | $235,900 |
| 2021 | $8,837 | $411,000 | $175,100 | $235,900 |
| 2020 | $8,462 | $411,000 | $175,100 | $235,900 |
| 2019 | $8,228 | $411,000 | $175,100 | $235,900 |
| 2018 | $8,017 | $350,400 | $151,500 | $198,900 |
| 2017 | $7,838 | $350,400 | $151,500 | $198,900 |
| 2016 | $7,800 | $350,400 | $151,500 | $198,900 |
| 2015 | $7,984 | $347,900 | $110,600 | $237,300 |
| 2014 | $7,984 | $347,900 | $110,600 | $237,300 |
Source: Public Records
Map
Nearby Homes
Your Personal Tour Guide
Ask me questions while you tour the home.