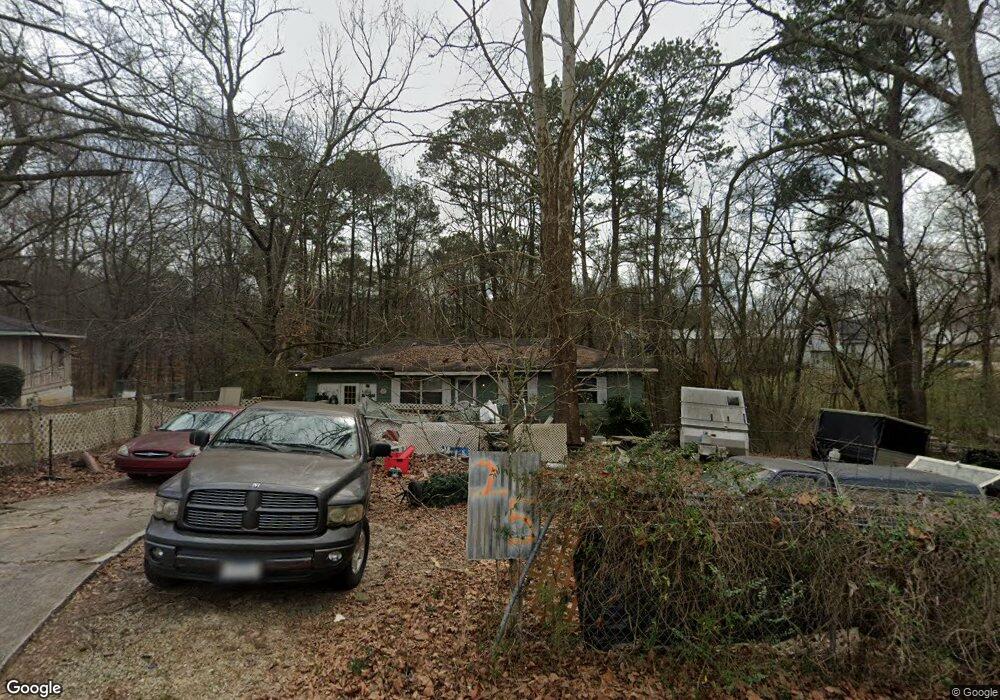
25 Carroll St Temple, GA 30179
Estimated Value: $169,100 - $217,000
3
Beds
1
Bath
960
Sq Ft
$193/Sq Ft
Est. Value
About This Home
This home is located at 25 Carroll St, Temple, GA 30179 and is currently estimated at $185,525, approximately $193 per square foot. 25 Carroll St is a home with nearby schools including Providence Elementary School, Temple Middle School, and Temple High School.
Ownership History
Date
Name
Owned For
Owner Type
Purchase Details
Closed on
May 5, 2023
Sold by
Stern Lloyd R
Bought by
Stern Lloyd R and Stern Raven Nicole
Current Estimated Value
Purchase Details
Closed on
Apr 12, 2023
Sold by
Phillips Winford
Bought by
Stern Lloyd
Purchase Details
Closed on
Aug 21, 2003
Sold by
Phillips Winford
Bought by
Phillips Winford and Phillips Timothy W
Purchase Details
Closed on
Jun 20, 2003
Sold by
Secretary Of Hud
Bought by
Phillips Winford
Purchase Details
Closed on
Aug 6, 2002
Sold by
Chase Manhatten
Bought by
Secretary Of Hud
Purchase Details
Closed on
Feb 25, 2000
Sold by
Phillips Timothy W
Bought by
Boykin Danny W
Purchase Details
Closed on
Aug 3, 1999
Sold by
Phillips Rosie
Bought by
Phillips Timothy W
Purchase Details
Closed on
Aug 8, 1998
Sold by
Mott Francine
Bought by
Phillips Rosie
Purchase Details
Closed on
Mar 1, 1996
Sold by
Thornton
Bought by
Mott Francine
Purchase Details
Closed on
Dec 2, 1993
Sold by
Thornton Lagrande
Bought by
Thornton
Create a Home Valuation Report for This Property
The Home Valuation Report is an in-depth analysis detailing your home's value as well as a comparison with similar homes in the area
Home Values in the Area
Average Home Value in this Area
Purchase History
| Date | Buyer | Sale Price | Title Company |
|---|---|---|---|
| Stern Lloyd R | -- | -- | |
| Stern Lloyd | $50,000 | -- | |
| Phillips Winford | -- | -- | |
| Phillips Winford | -- | -- | |
| Secretary Of Hud | $65,500 | -- | |
| Chase Manhatten | $65,500 | -- | |
| Boykin Danny W | $61,400 | -- | |
| Phillips Timothy W | $30,000 | -- | |
| Phillips Rosie | -- | -- | |
| Mott Francine | $42,000 | -- | |
| Thornton | -- | -- |
Source: Public Records
Tax History
| Year | Tax Paid | Tax Assessment Tax Assessment Total Assessment is a certain percentage of the fair market value that is determined by local assessors to be the total taxable value of land and additions on the property. | Land | Improvement |
|---|---|---|---|---|
| 2025 | $184 | $31,412 | $10,150 | $21,262 |
| 2024 | $160 | $31,412 | $10,150 | $21,262 |
| 2023 | $160 | $29,647 | $10,151 | $19,496 |
| 2022 | $683 | $22,562 | $6,784 | $15,778 |
| 2021 | $583 | $18,755 | $5,025 | $13,730 |
| 2020 | $542 | $17,359 | $5,025 | $12,334 |
| 2019 | $516 | $16,407 | $5,025 | $11,382 |
| 2018 | $507 | $15,657 | $5,025 | $10,632 |
| 2017 | $513 | $15,657 | $5,025 | $10,632 |
| 2016 | $520 | $15,816 | $5,584 | $10,232 |
| 2015 | $556 | $15,916 | $5,000 | $10,917 |
| 2014 | $559 | $15,917 | $5,000 | $10,917 |
Source: Public Records
Map
Nearby Homes
- 96 Rome St
- 221 Rome St
- 110 Driver St
- 130 Carroll St
- 25 Old Bremen Rd
- 44 E Johnson St
- 0 Highway 113 Unit 10586141
- 140 Creek Crossing Ln
- 121 E Woodland Manor
- 407 Nottely Dr
- 51 Carrollton St
- 408 Nottely Dr
- 92 James St
- 380 Rome St
- 95 Carrollton St
- 119 E Johnson St
- 506 Lanier Way
- 100 Rainey Rd
- 192 Rainey Rd
- 136 Rainey Rd
Your Personal Tour Guide
Ask me questions while you tour the home.