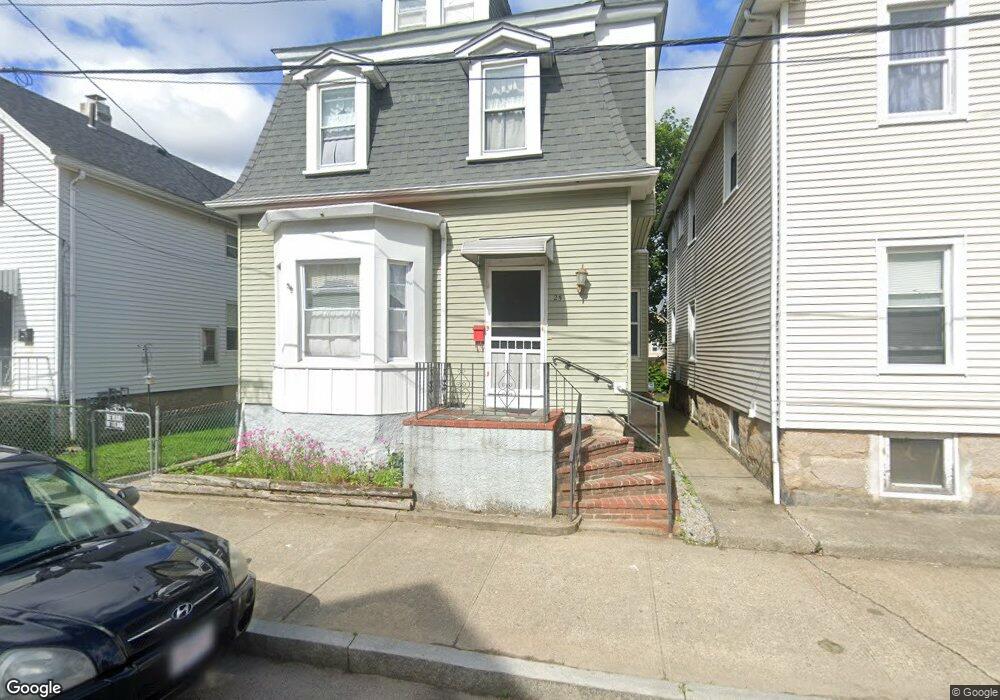
25 Cedar St Unit 1 New Bedford, MA 02740
Downtown New Bedford NeighborhoodEstimated Value: $370,000 - $412,000
3
Beds
2
Baths
1,464
Sq Ft
$264/Sq Ft
Est. Value
About This Home
This home is located at 25 Cedar St Unit 1, New Bedford, MA 02740 and is currently estimated at $386,534, approximately $264 per square foot. 25 Cedar St Unit 1 is a home located in Bristol County with nearby schools including Sgt. William Carney Memorial Academy, Keith Middle School, and New Bedford High School.
Ownership History
Date
Name
Owned For
Owner Type
Purchase Details
Closed on
Apr 2, 2009
Sold by
Fnma
Bought by
Federal National Mortgage Association and Nicali Prop Llc
Current Estimated Value
Purchase Details
Closed on
Apr 22, 2008
Sold by
Faria Derek
Bought by
Federal National Mortgage Association
Purchase Details
Closed on
Mar 11, 2002
Sold by
Rosa Daniel E and Bay Loan & Invest Bk
Bought by
Bay Loan & Invest Bk
Create a Home Valuation Report for This Property
The Home Valuation Report is an in-depth analysis detailing your home's value as well as a comparison with similar homes in the area
Home Values in the Area
Average Home Value in this Area
Purchase History
| Date | Buyer | Sale Price | Title Company |
|---|---|---|---|
| Federal National Mortgage Association | $35,000 | -- | |
| Federal National Mortgage Association | $35,000 | -- | |
| Federal National Mortgage Association | $110,273 | -- | |
| Federal National Mortgage Association | $110,273 | -- | |
| Bay Loan & Invest Bk | $30,000 | -- | |
| Bay Loan & Invest Bk | $30,000 | -- |
Source: Public Records
Mortgage History
| Date | Status | Borrower | Loan Amount |
|---|---|---|---|
| Previous Owner | Bay Loan & Invest Bk | $132,000 | |
| Previous Owner | Bay Loan & Invest Bk | $75,000 |
Source: Public Records
Tax History Compared to Growth
Tax History
| Year | Tax Paid | Tax Assessment Tax Assessment Total Assessment is a certain percentage of the fair market value that is determined by local assessors to be the total taxable value of land and additions on the property. | Land | Improvement |
|---|---|---|---|---|
| 2025 | $3,384 | $299,200 | $84,700 | $214,500 |
| 2024 | $3,086 | $257,200 | $78,700 | $178,500 |
| 2023 | $3,088 | $216,100 | $66,600 | $149,500 |
| 2022 | $2,621 | $178,600 | $60,500 | $118,100 |
| 2021 | $2,621 | $168,100 | $57,500 | $110,600 |
| 2020 | $2,605 | $161,200 | $57,500 | $103,700 |
| 2019 | $2,494 | $151,400 | $57,500 | $93,900 |
| 2018 | $2,340 | $140,700 | $57,500 | $83,200 |
| 2017 | $2,246 | $134,600 | $56,000 | $78,600 |
| 2016 | $2,144 | $130,000 | $54,500 | $75,500 |
| 2015 | $2,015 | $128,100 | $54,500 | $73,600 |
| 2014 | $1,912 | $126,100 | $53,000 | $73,100 |
Source: Public Records
Map
Nearby Homes