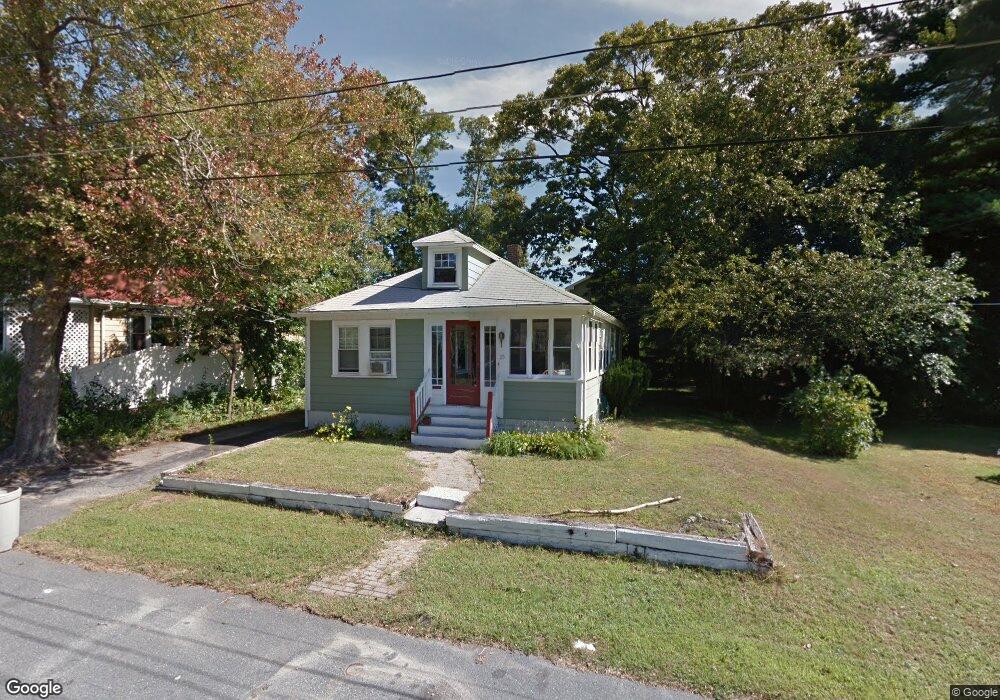
25 Cedarway Stoneham, MA 02180
Colonial Park NeighborhoodEstimated Value: $539,000 - $696,000
2
Beds
1
Bath
910
Sq Ft
$702/Sq Ft
Est. Value
About This Home
This home is located at 25 Cedarway, Stoneham, MA 02180 and is currently estimated at $639,008, approximately $702 per square foot. 25 Cedarway is a home located in Middlesex County with nearby schools including Stoneham High School, St. Patrick Elementary School, and Greater Boston Academy.
Ownership History
Date
Name
Owned For
Owner Type
Purchase Details
Closed on
May 10, 1996
Sold by
Fhlmc
Bought by
Chavez Joseph M
Current Estimated Value
Home Financials for this Owner
Home Financials are based on the most recent Mortgage that was taken out on this home.
Original Mortgage
$90,000
Outstanding Balance
$4,974
Interest Rate
7.67%
Mortgage Type
Purchase Money Mortgage
Estimated Equity
$634,034
Purchase Details
Closed on
Oct 16, 1995
Sold by
Fogel John R and Fogel Pamela A
Bought by
Fhlmc
Purchase Details
Closed on
Jul 22, 1988
Sold by
Stevenson Raymond
Bought by
Fogel John R
Home Financials for this Owner
Home Financials are based on the most recent Mortgage that was taken out on this home.
Original Mortgage
$131,300
Interest Rate
10.49%
Mortgage Type
Purchase Money Mortgage
Create a Home Valuation Report for This Property
The Home Valuation Report is an in-depth analysis detailing your home's value as well as a comparison with similar homes in the area
Home Values in the Area
Average Home Value in this Area
Purchase History
| Date | Buyer | Sale Price | Title Company |
|---|---|---|---|
| Chavez Joseph M | $95,000 | -- | |
| Fhlmc | $98,100 | -- | |
| Fogel John R | $149,000 | -- |
Source: Public Records
Mortgage History
| Date | Status | Borrower | Loan Amount |
|---|---|---|---|
| Open | Fogel John R | $50,000 | |
| Closed | Fogel John R | $20,000 | |
| Open | Fogel John R | $90,000 | |
| Previous Owner | Fogel John R | $131,300 |
Source: Public Records
Tax History
| Year | Tax Paid | Tax Assessment Tax Assessment Total Assessment is a certain percentage of the fair market value that is determined by local assessors to be the total taxable value of land and additions on the property. | Land | Improvement |
|---|---|---|---|---|
| 2025 | $6,110 | $597,300 | $380,200 | $217,100 |
| 2024 | $5,941 | $561,000 | $350,200 | $210,800 |
| 2023 | $5,894 | $531,000 | $320,200 | $210,800 |
| 2022 | $5,101 | $490,000 | $290,200 | $199,800 |
| 2021 | $5,138 | $474,900 | $280,200 | $194,700 |
| 2020 | $4,908 | $454,900 | $270,200 | $184,700 |
| 2019 | $4,844 | $431,700 | $250,200 | $181,500 |
| 2018 | $4,525 | $386,400 | $230,200 | $156,200 |
| 2017 | $4,614 | $372,400 | $220,200 | $152,200 |
| 2016 | $4,172 | $328,500 | $220,200 | $108,300 |
| 2015 | $4,036 | $311,400 | $210,200 | $101,200 |
| 2014 | $4,166 | $308,800 | $200,200 | $108,600 |
Source: Public Records
Map
Nearby Homes
- 12 Lovis Ave
- 9 Lovis Ave
- 11 Valdora Dr
- 3 Valley Rd
- 51 Spring St
- 11 Ludlow Ave
- 824 Main St Unit 1
- 4 Garfield Ave
- 33 Lake Ave
- 58 Washington St
- 35 Tremont St
- 17 Franklin St
- 159 Franklin St Unit D2
- 159 Franklin St Unit C2
- 159 Franklin St Unit E6
- 1 Sidney St
- 137 Franklin St Unit 102
- 21 Tremont St Unit B
- 21 Tremont St Unit A
- 55 Bartley St
Your Personal Tour Guide
Ask me questions while you tour the home.