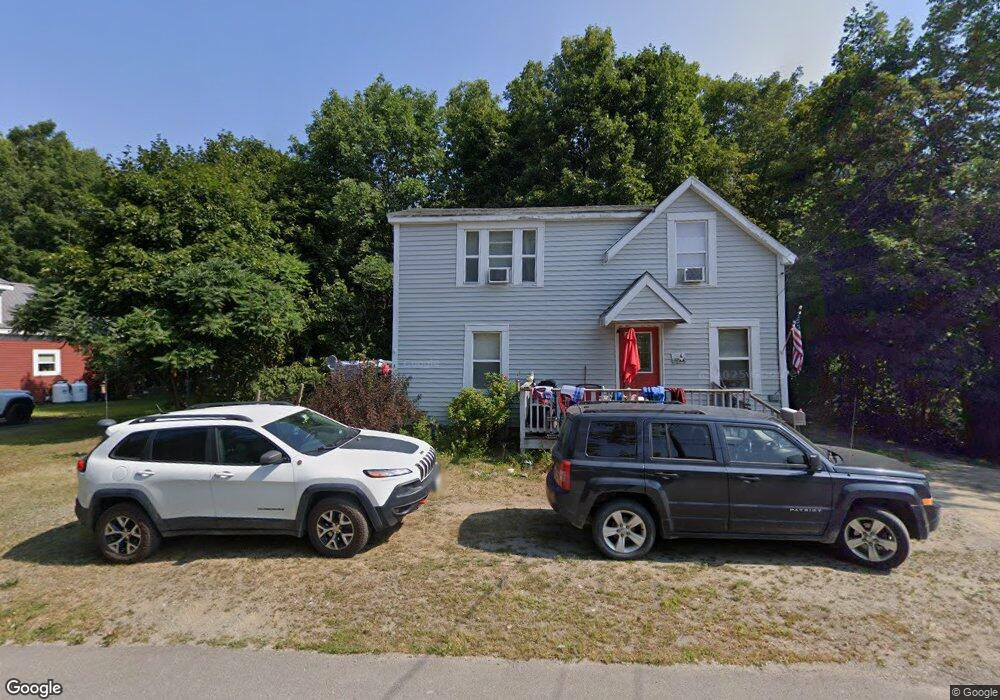
25 Chandler St Calais, ME 04619
Estimated Value: $116,000 - $146,000
2
Beds
1
Bath
975
Sq Ft
$134/Sq Ft
Est. Value
About This Home
This home is located at 25 Chandler St, Calais, ME 04619 and is currently estimated at $130,442, approximately $133 per square foot. 25 Chandler St is a home located in Washington County with nearby schools including Calais Elementary School and Calais Middle/High School.
Ownership History
Date
Name
Owned For
Owner Type
Purchase Details
Closed on
Jan 13, 2020
Sold by
Bard Leonard J and Bard Dana M
Bought by
Morris Brittin and Morris Brian
Current Estimated Value
Home Financials for this Owner
Home Financials are based on the most recent Mortgage that was taken out on this home.
Original Mortgage
$32,000
Outstanding Balance
$28,273
Interest Rate
3.6%
Mortgage Type
New Conventional
Estimated Equity
$102,169
Purchase Details
Closed on
Nov 20, 2006
Sold by
Lewis Charles R
Bought by
Bard Leonard J and Bard Dana M
Create a Home Valuation Report for This Property
The Home Valuation Report is an in-depth analysis detailing your home's value as well as a comparison with similar homes in the area
Home Values in the Area
Average Home Value in this Area
Purchase History
| Date | Buyer | Sale Price | Title Company |
|---|---|---|---|
| Morris Brittin | -- | Liberty Title & Escrow Compa | |
| Bard Leonard J | -- | -- |
Source: Public Records
Mortgage History
| Date | Status | Borrower | Loan Amount |
|---|---|---|---|
| Open | Morris Brittin | $32,000 |
Source: Public Records
Tax History Compared to Growth
Tax History
| Year | Tax Paid | Tax Assessment Tax Assessment Total Assessment is a certain percentage of the fair market value that is determined by local assessors to be the total taxable value of land and additions on the property. | Land | Improvement |
|---|---|---|---|---|
| 2024 | $1,095 | $73,000 | $12,800 | $60,200 |
| 2023 | $1,063 | $62,500 | $11,000 | $51,500 |
| 2022 | $942 | $49,600 | $8,700 | $40,900 |
| 2021 | $1,022 | $47,300 | $8,300 | $39,000 |
| 2020 | $1,007 | $39,800 | $7,000 | $32,800 |
| 2019 | $1,007 | $39,800 | $7,000 | $32,800 |
| 2018 | $1,007 | $39,800 | $7,000 | $32,800 |
| 2017 | $1,007 | $39,800 | $7,000 | $32,800 |
| 2016 | $1,007 | $39,800 | $7,000 | $32,800 |
| 2015 | $1,007 | $39,800 | $7,000 | $32,800 |
| 2014 | $1,007 | $39,800 | $7,000 | $32,800 |
| 2013 | $1,007 | $39,800 | $7,000 | $32,800 |
Source: Public Records
Map
Nearby Homes