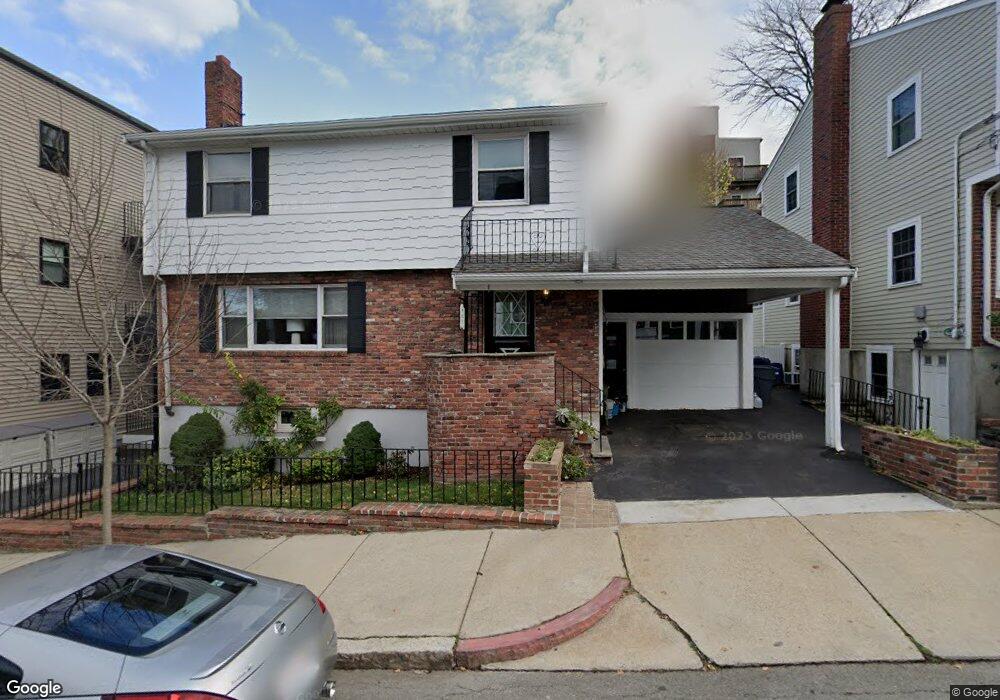
25 Chappie St Charlestown, MA 02129
Medford Street-The Neck NeighborhoodEstimated Value: $1,359,882 - $1,593,000
3
Beds
2
Baths
1,530
Sq Ft
$986/Sq Ft
Est. Value
About This Home
This home is located at 25 Chappie St, Charlestown, MA 02129 and is currently estimated at $1,508,721, approximately $986 per square foot. 25 Chappie St is a home located in Suffolk County with nearby schools including Prospect Hill Academy Upper Elementary Campus and Bright Future Educare Center.
Ownership History
Date
Name
Owned For
Owner Type
Purchase Details
Closed on
Feb 6, 2024
Sold by
Lewis James E
Bought by
James E Lewis Lt and Lewis
Current Estimated Value
Home Financials for this Owner
Home Financials are based on the most recent Mortgage that was taken out on this home.
Original Mortgage
$370,000
Interest Rate
7.02%
Mortgage Type
Credit Line Revolving
Create a Home Valuation Report for This Property
The Home Valuation Report is an in-depth analysis detailing your home's value as well as a comparison with similar homes in the area
Home Values in the Area
Average Home Value in this Area
Purchase History
| Date | Buyer | Sale Price | Title Company |
|---|---|---|---|
| James E Lewis Lt | -- | None Available | |
| James E Lewis Lt | -- | None Available |
Source: Public Records
Mortgage History
| Date | Status | Borrower | Loan Amount |
|---|---|---|---|
| Previous Owner | James E Lewis Lt | $370,000 |
Source: Public Records
Tax History Compared to Growth
Tax History
| Year | Tax Paid | Tax Assessment Tax Assessment Total Assessment is a certain percentage of the fair market value that is determined by local assessors to be the total taxable value of land and additions on the property. | Land | Improvement |
|---|---|---|---|---|
| 2025 | $12,393 | $1,070,200 | $404,700 | $665,500 |
| 2024 | $12,216 | $1,120,700 | $432,900 | $687,800 |
| 2023 | $11,464 | $1,067,400 | $412,300 | $655,100 |
| 2022 | $10,437 | $959,300 | $374,900 | $584,400 |
| 2021 | $10,034 | $940,400 | $367,500 | $572,900 |
| 2020 | $9,116 | $863,300 | $359,800 | $503,500 |
| 2019 | $8,912 | $845,500 | $296,400 | $549,100 |
| 2018 | $8,362 | $797,900 | $296,400 | $501,500 |
| 2017 | $7,821 | $738,500 | $296,400 | $442,100 |
| 2016 | $7,592 | $690,200 | $296,400 | $393,800 |
| 2015 | $7,227 | $596,800 | $242,000 | $354,800 |
| 2014 | $6,626 | $526,700 | $242,000 | $284,700 |
Source: Public Records
Map
Nearby Homes
- 40 Chappie St Unit 1
- 100 Baldwin St Unit 1
- 9 Short St
- 364 Bunker Hill St Unit 1
- 24 N Mead St
- 9 Armory St
- 56 Belmont St Unit 1
- 64 Walker St Unit 66
- 29 Eden St Unit 3
- 270 Bunker Hill St Unit 4
- 255 Bunker Hill St Unit 2
- 15 Russell St
- 9 Russell St Unit 2
- 9 Russell St Unit 1
- 254-256 Medford St Unit 2
- 207 Bunker Hill St Unit 2
- 24 Brighton St
- 172 Bunker Hill St Unit 1
- 39 Mount Pleasant St
- 19 Parker St Unit 3
- 19 Chappie St
- 21 Chappie St
- 39 Chappie St
- 39 Chappie St Unit 3
- 39 Chappie St Unit 2
- 39 Chappie St Unit 1
- 18R Saint Martin St
- 41 Chappie St Unit 1
- 26 Saint Martin St
- 26 Saint Martin St Unit C
- 26 Saint Martin St Unit B
- 15 Chappie St
- 26 St Martin St Unit C
- 26 St Martin St Unit B
- 20 Chappie St
- 16 Chappie St
- 18 Chappie St Unit 18
- 16 Saint Martin St
- 40 Chappie St Unit 3
- 40 Chappie St Unit 2