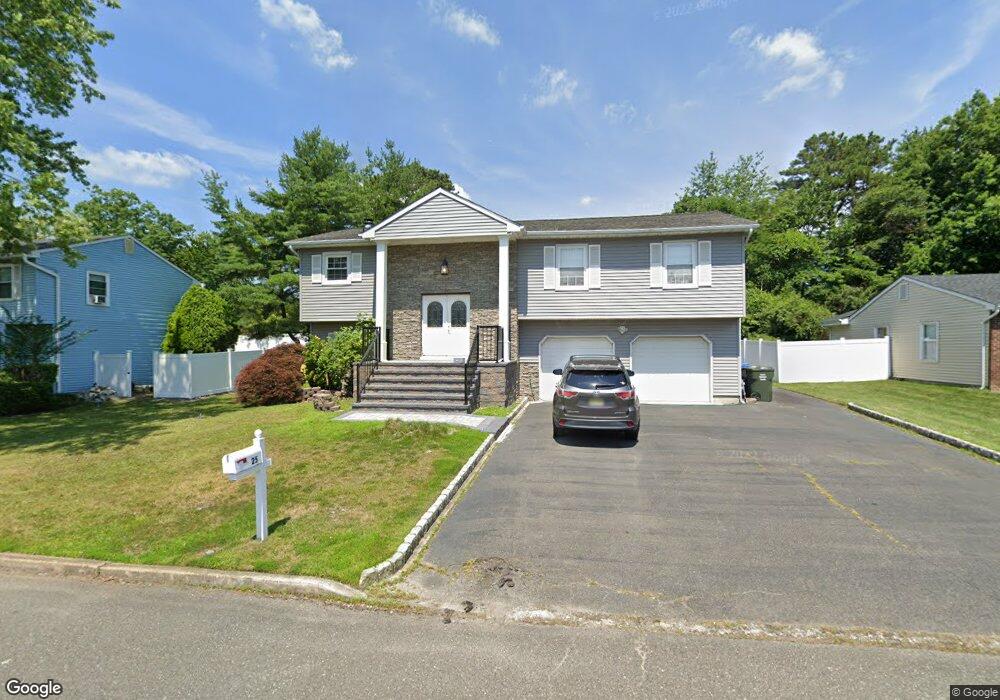
25 Charles Dr Tinton Falls, NJ 07753
Estimated Value: $726,000 - $845,000
4
Beds
3
Baths
2,544
Sq Ft
$303/Sq Ft
Est. Value
About This Home
This home is located at 25 Charles Dr, Tinton Falls, NJ 07753 and is currently estimated at $772,052, approximately $303 per square foot. 25 Charles Dr is a home located in Monmouth County with nearby schools including Mahala F. Atchinson Elementary School, Swimming River Elementary School, and Tinton Falls Middle School.
Ownership History
Date
Name
Owned For
Owner Type
Purchase Details
Closed on
Jun 26, 2003
Sold by
Dente Peter
Bought by
Aehlich William and Aehlich Cynthia
Current Estimated Value
Home Financials for this Owner
Home Financials are based on the most recent Mortgage that was taken out on this home.
Original Mortgage
$315,000
Outstanding Balance
$134,124
Interest Rate
5.28%
Estimated Equity
$637,928
Create a Home Valuation Report for This Property
The Home Valuation Report is an in-depth analysis detailing your home's value as well as a comparison with similar homes in the area
Home Values in the Area
Average Home Value in this Area
Purchase History
| Date | Buyer | Sale Price | Title Company |
|---|---|---|---|
| Aehlich William | $370,000 | -- |
Source: Public Records
Mortgage History
| Date | Status | Borrower | Loan Amount |
|---|---|---|---|
| Open | Aehlich William | $315,000 |
Source: Public Records
Tax History Compared to Growth
Tax History
| Year | Tax Paid | Tax Assessment Tax Assessment Total Assessment is a certain percentage of the fair market value that is determined by local assessors to be the total taxable value of land and additions on the property. | Land | Improvement |
|---|---|---|---|---|
| 2025 | $8,864 | $654,100 | $310,600 | $343,500 |
| 2024 | $8,021 | $616,000 | $280,400 | $335,600 |
| 2023 | $8,021 | $525,600 | $225,000 | $300,600 |
| 2022 | $8,251 | $487,400 | $201,200 | $286,200 |
| 2021 | $8,167 | $428,400 | $194,700 | $233,700 |
| 2020 | $8,004 | $401,200 | $152,400 | $248,800 |
| 2019 | $8,167 | $410,000 | $162,600 | $247,400 |
| 2018 | $8,519 | $426,400 | $164,700 | $261,700 |
| 2017 | $8,450 | $412,400 | $158,600 | $253,800 |
| 2016 | $8,774 | $418,600 | $171,200 | $247,400 |
| 2015 | $8,533 | $412,200 | $171,200 | $241,000 |
| 2014 | $8,104 | $374,500 | $117,400 | $257,100 |
Source: Public Records
Map
Nearby Homes