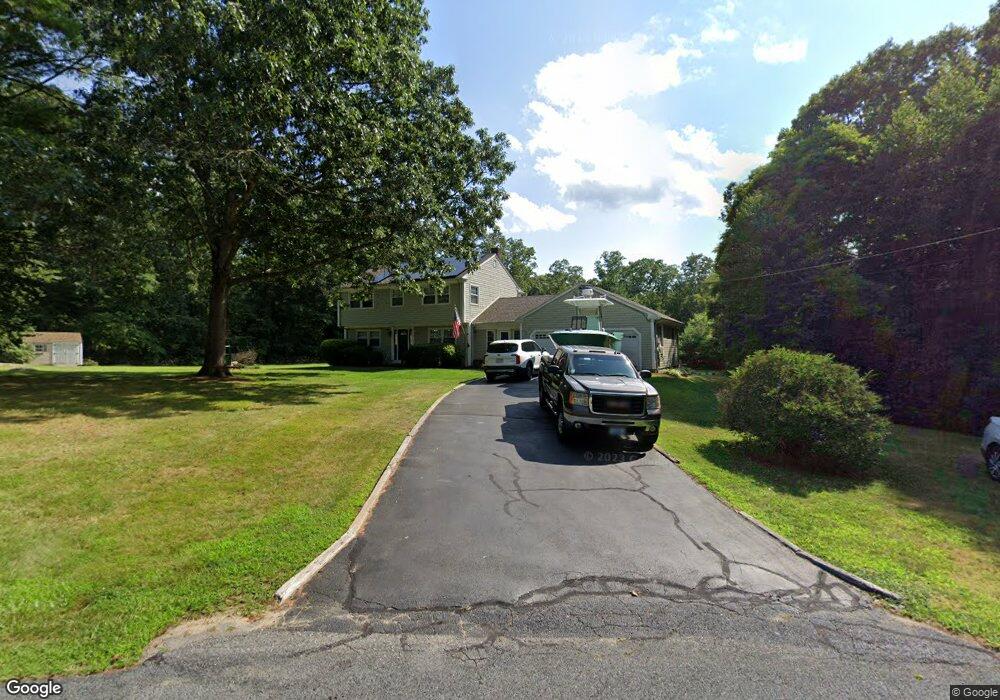
25 Christopher Cir Westport, MA 02790
North Westport NeighborhoodEstimated Value: $687,697 - $834,000
3
Beds
2
Baths
2,708
Sq Ft
$282/Sq Ft
Est. Value
About This Home
This home is located at 25 Christopher Cir, Westport, MA 02790 and is currently estimated at $762,424, approximately $281 per square foot. 25 Christopher Cir is a home located in Bristol County with nearby schools including Alice A. Macomber Primary School, Westport Elementary School, and Westport Middle-High School.
Ownership History
Date
Name
Owned For
Owner Type
Purchase Details
Closed on
Sep 25, 2015
Sold by
Enos Richard J and Enos Tracy A
Bought by
Enos Tracy A
Current Estimated Value
Purchase Details
Closed on
Aug 27, 2007
Sold by
Enos Michelle A and Enos Richard Jay
Bought by
Enos Richard J and Enos Tracy A
Home Financials for this Owner
Home Financials are based on the most recent Mortgage that was taken out on this home.
Original Mortgage
$339,200
Interest Rate
6.78%
Mortgage Type
Purchase Money Mortgage
Purchase Details
Closed on
Jan 13, 1989
Sold by
Russell David F
Bought by
Enos Richard Jay
Home Financials for this Owner
Home Financials are based on the most recent Mortgage that was taken out on this home.
Original Mortgage
$75,000
Interest Rate
10.39%
Mortgage Type
Purchase Money Mortgage
Create a Home Valuation Report for This Property
The Home Valuation Report is an in-depth analysis detailing your home's value as well as a comparison with similar homes in the area
Home Values in the Area
Average Home Value in this Area
Purchase History
| Date | Buyer | Sale Price | Title Company |
|---|---|---|---|
| Enos Tracy A | -- | -- | |
| Enos Richard J | $424,000 | -- | |
| Enos Richard Jay | $204,000 | -- |
Source: Public Records
Mortgage History
| Date | Status | Borrower | Loan Amount |
|---|---|---|---|
| Previous Owner | Enos Richard Jay | $343,000 | |
| Previous Owner | Enos Richard Jay | $339,200 | |
| Previous Owner | Enos Richard Jay | $35,000 | |
| Previous Owner | Enos Richard Jay | $75,000 |
Source: Public Records
Tax History Compared to Growth
Tax History
| Year | Tax Paid | Tax Assessment Tax Assessment Total Assessment is a certain percentage of the fair market value that is determined by local assessors to be the total taxable value of land and additions on the property. | Land | Improvement |
|---|---|---|---|---|
| 2025 | $4,135 | $555,100 | $168,700 | $386,400 |
| 2024 | $4,126 | $533,800 | $156,300 | $377,500 |
| 2023 | $4,037 | $494,700 | $142,100 | $352,600 |
| 2022 | $3,848 | $453,800 | $142,100 | $311,700 |
| 2021 | $3,491 | $405,000 | $129,200 | $275,800 |
| 2020 | $3,904 | $390,500 | $124,000 | $266,500 |
| 2019 | $3,025 | $365,800 | $124,000 | $241,800 |
| 2018 | $3,657 | $377,100 | $124,200 | $252,900 |
| 2017 | $3,079 | $386,300 | $124,200 | $262,100 |
| 2016 | $3,104 | $392,400 | $124,200 | $268,200 |
| 2015 | $2,829 | $356,700 | $124,200 | $232,500 |
Source: Public Records
Map
Nearby Homes