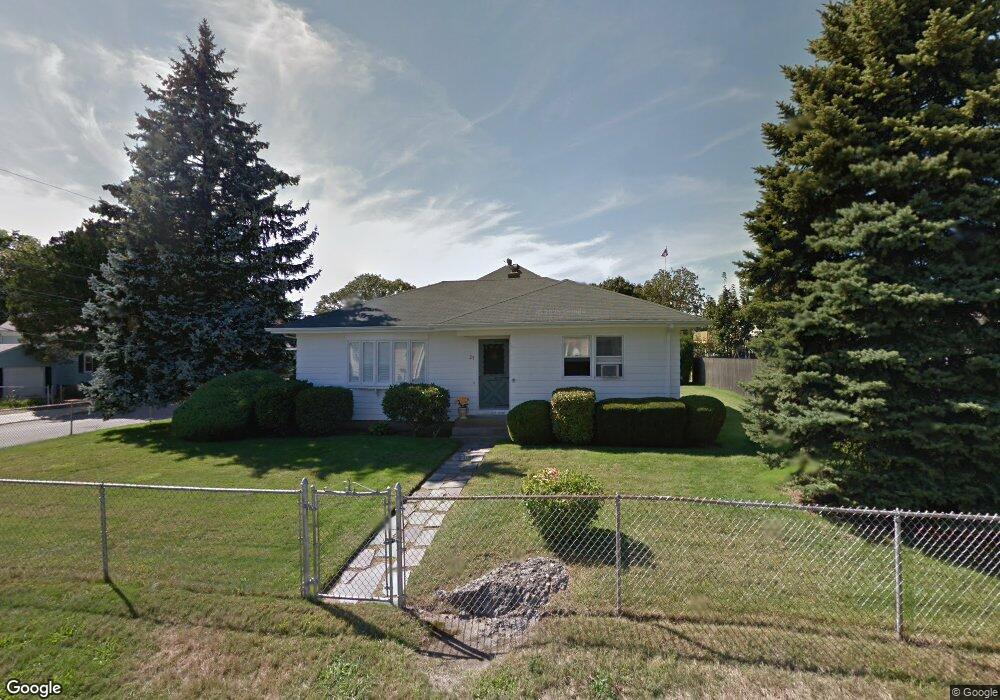
25 Clay St Fall River, MA 02724
Maplewood NeighborhoodEstimated Value: $365,247 - $408,000
2
Beds
1
Bath
1,017
Sq Ft
$372/Sq Ft
Est. Value
About This Home
This home is located at 25 Clay St, Fall River, MA 02724 and is currently estimated at $378,562, approximately $372 per square foot. 25 Clay St is a home located in Bristol County with nearby schools including Letourneau Elementary School, Matthew J. Kuss Middle School, and B M C Durfee High School.
Ownership History
Date
Name
Owned For
Owner Type
Purchase Details
Closed on
Aug 27, 1999
Sold by
Regan Irt
Bought by
Quintal Henry P and Quintal Cheryl A
Current Estimated Value
Home Financials for this Owner
Home Financials are based on the most recent Mortgage that was taken out on this home.
Original Mortgage
$129,465
Interest Rate
7.53%
Mortgage Type
Purchase Money Mortgage
Create a Home Valuation Report for This Property
The Home Valuation Report is an in-depth analysis detailing your home's value as well as a comparison with similar homes in the area
Home Values in the Area
Average Home Value in this Area
Purchase History
| Date | Buyer | Sale Price | Title Company |
|---|---|---|---|
| Quintal Henry P | $126,000 | -- |
Source: Public Records
Mortgage History
| Date | Status | Borrower | Loan Amount |
|---|---|---|---|
| Open | Quintal Henry P | $100,000 | |
| Closed | Quintal Henry P | $132,146 | |
| Closed | Quintal Henry P | $129,465 |
Source: Public Records
Tax History
| Year | Tax Paid | Tax Assessment Tax Assessment Total Assessment is a certain percentage of the fair market value that is determined by local assessors to be the total taxable value of land and additions on the property. | Land | Improvement |
|---|---|---|---|---|
| 2025 | $3,379 | $295,100 | $118,800 | $176,300 |
| 2024 | $3,193 | $277,900 | $116,500 | $161,400 |
| 2023 | $3,109 | $253,400 | $105,000 | $148,400 |
| 2022 | $2,622 | $219,400 | $99,000 | $120,400 |
| 2021 | $2,622 | $189,600 | $94,600 | $95,000 |
| 2020 | $2,535 | $175,400 | $90,300 | $85,100 |
| 2019 | $2,531 | $173,600 | $94,400 | $79,200 |
| 2018 | $2,510 | $171,700 | $95,100 | $76,600 |
| 2017 | $2,386 | $170,400 | $95,100 | $75,300 |
| 2016 | $2,310 | $169,500 | $98,000 | $71,500 |
| 2015 | $2,217 | $169,500 | $98,000 | $71,500 |
| 2014 | $2,132 | $169,500 | $98,000 | $71,500 |
Source: Public Records
Map
Nearby Homes
Your Personal Tour Guide
Ask me questions while you tour the home.