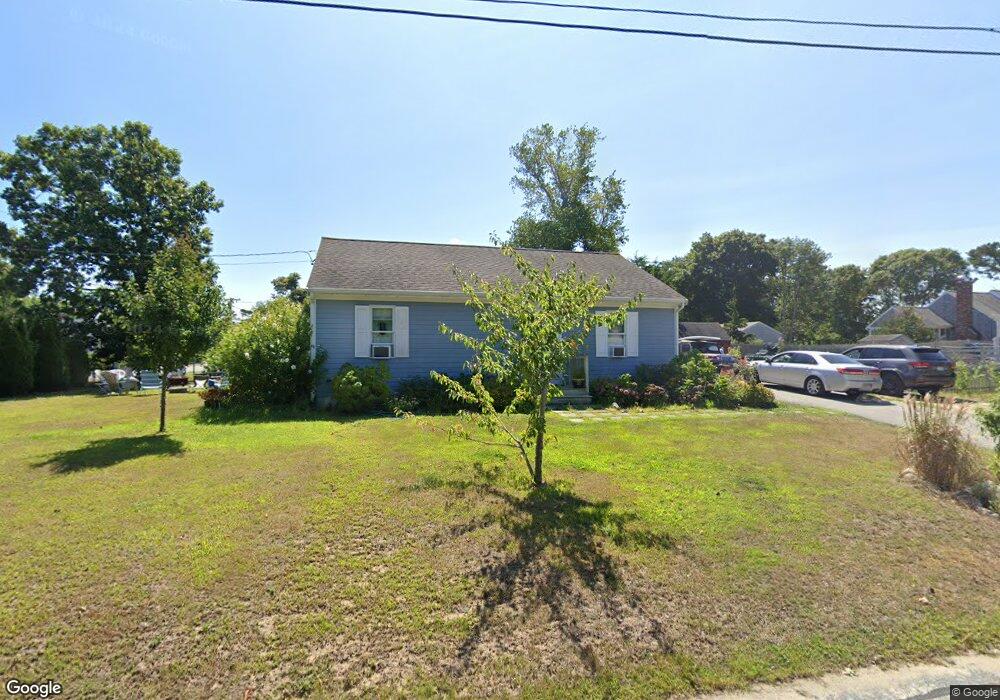
25 Cross St Dennis Port, MA 2639
Dennis Port NeighborhoodEstimated Value: $367,076 - $477,000
2
Beds
1
Bath
936
Sq Ft
$460/Sq Ft
Est. Value
About This Home
This home is located at 25 Cross St, Dennis Port, MA 2639 and is currently estimated at $430,519, approximately $459 per square foot. 25 Cross St is a home located in Barnstable County with nearby schools including Dennis-Yarmouth Regional High School and St. Pius X. School.
Ownership History
Date
Name
Owned For
Owner Type
Purchase Details
Closed on
Dec 7, 2010
Sold by
Cod Hab Humanity Cape
Bought by
Moriarty Kelley
Current Estimated Value
Home Financials for this Owner
Home Financials are based on the most recent Mortgage that was taken out on this home.
Original Mortgage
$105,900
Outstanding Balance
$69,966
Interest Rate
4.22%
Mortgage Type
Purchase Money Mortgage
Estimated Equity
$360,553
Purchase Details
Closed on
Sep 14, 2009
Sold by
Dennis Town Of
Bought by
Habitat For Humanity
Create a Home Valuation Report for This Property
The Home Valuation Report is an in-depth analysis detailing your home's value as well as a comparison with similar homes in the area
Home Values in the Area
Average Home Value in this Area
Purchase History
| Date | Buyer | Sale Price | Title Company |
|---|---|---|---|
| Moriarty Kelley | $105,900 | -- | |
| Habitat For Humanity | -- | -- |
Source: Public Records
Mortgage History
| Date | Status | Borrower | Loan Amount |
|---|---|---|---|
| Open | Moriarty Kelley | $105,900 |
Source: Public Records
Tax History Compared to Growth
Tax History
| Year | Tax Paid | Tax Assessment Tax Assessment Total Assessment is a certain percentage of the fair market value that is determined by local assessors to be the total taxable value of land and additions on the property. | Land | Improvement |
|---|---|---|---|---|
| 2025 | $758 | $175,010 | $61,340 | $113,670 |
| 2024 | $778 | $177,160 | $61,340 | $115,820 |
| 2023 | $832 | $178,110 | $55,410 | $122,700 |
| 2022 | $835 | $149,110 | $55,410 | $93,700 |
| 2021 | $0 | $155,200 | $74,400 | $80,800 |
| 2020 | $876 | $143,600 | $68,600 | $75,000 |
| 2019 | $2,233 | $135,700 | $67,300 | $68,400 |
| 2018 | $0 | $133,700 | $69,400 | $64,300 |
| 2017 | $777 | $126,400 | $64,100 | $62,300 |
| 2016 | $794 | $121,600 | $66,700 | $54,900 |
| 2015 | $778 | $121,600 | $66,700 | $54,900 |
| 2014 | $699 | $110,100 | $58,700 | $51,400 |
Source: Public Records
Map
Nearby Homes
- 12 Cross St
- 159 Center St Unit 22
- 26 Manning Rd
- 73 Division St
- 221 Upper County Rd Unit 2A
- 221 Upper County Rd Unit 2A
- 10 Candlewood Ln Unit 2-1
- 12 Candlewood Ln Unit 2-9
- 102 Sea St
- 11 Ocean Park W
- 47 Telegraph Rd Unit 1
- 402 Old Wharf Rd
- 402 Old Wharf Rd
- 148 Belmont Rd
- 9 Country Ln
- 166 Upper County Rd Unit 1-4
- 22 Ferncliff Rd
- 9 Chase Ave Unit 6
- 405 Old Wharf Rd Unit B204
- 405 Old Wharf Rd Unit B204
- 125 Depot St
- 19 Cross St
- 121-A Depot St
- 132 Depot St Unit 2
- 132 Depot St Unit 1
- 132 Depot St Unit A&B
- 132 Depot St
- 123 Depot St
- 121 Depot St
- 121 Depot St
- 121 Depot St Unit A
- 137 Depot St
- 18 Cross St
- 18 Cross St Unit 2
- 121 Depot St A
- 41 Pleasant St
- 39 Pleasant St
- 142 Depot St
- 117 Depot St
- 117 Depot St Unit 1