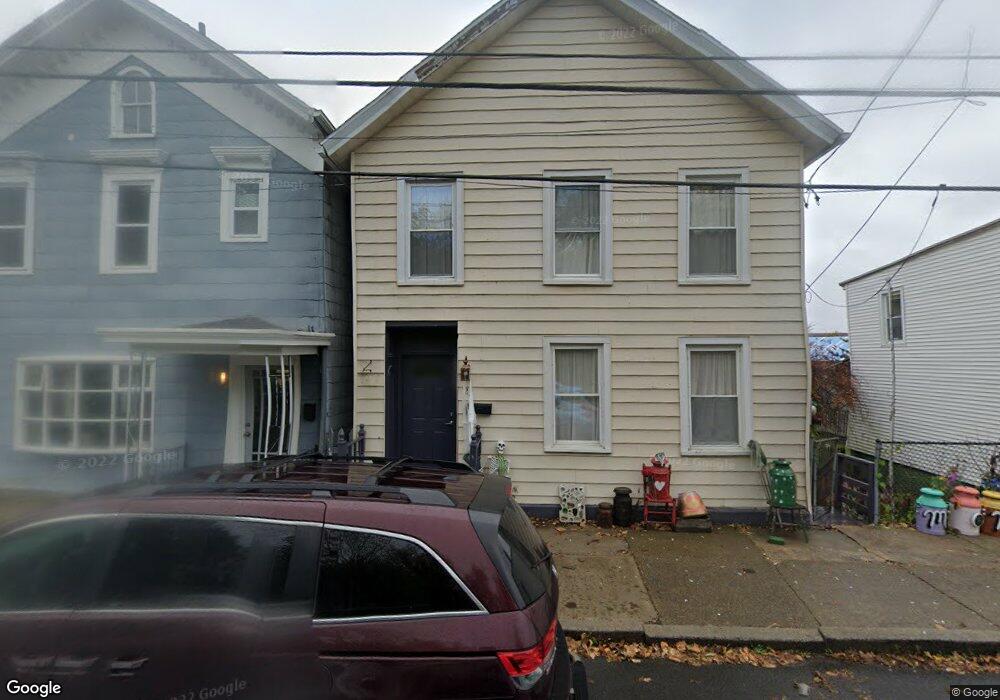
25 Cross St Hudson, NY 12534
Estimated Value: $508,000 - $630,092
2
Beds
2
Baths
1,500
Sq Ft
$387/Sq Ft
Est. Value
About This Home
This home is located at 25 Cross St, Hudson, NY 12534 and is currently estimated at $580,523, approximately $387 per square foot. 25 Cross St is a home located in Columbia County with nearby schools including Montgomery C. Smith Elementary School and Hudson Senior High School.
Ownership History
Date
Name
Owned For
Owner Type
Purchase Details
Closed on
Sep 3, 2025
Sold by
25 Cross Street Llc
Bought by
South Frnt St Hldgs Llc
Current Estimated Value
Purchase Details
Closed on
Jan 20, 2021
Sold by
Csukas Edwin and Meza Teresa
Bought by
25 Cross Street Llc
Purchase Details
Closed on
Sep 22, 2016
Sold by
Henry Amanda
Bought by
Csukas Edwin
Home Financials for this Owner
Home Financials are based on the most recent Mortgage that was taken out on this home.
Original Mortgage
$281,000
Interest Rate
3.43%
Mortgage Type
New Conventional
Purchase Details
Closed on
Jun 10, 2008
Sold by
Henry Amanda
Bought by
Henry Amanda
Purchase Details
Closed on
Aug 5, 2005
Sold by
Jen Jack Productions Inc Profit Sharing Plan
Bought by
Henry Amanda
Purchase Details
Closed on
Oct 12, 2004
Sold by
Fenoff Gerald E
Bought by
Jenjack Productions Inc P Rofit Sharing Plan
Create a Home Valuation Report for This Property
The Home Valuation Report is an in-depth analysis detailing your home's value as well as a comparison with similar homes in the area
Home Values in the Area
Average Home Value in this Area
Purchase History
| Date | Buyer | Sale Price | Title Company |
|---|---|---|---|
| South Frnt St Hldgs Llc | -- | -- | |
| 25 Cross Street Llc | $320,000 | Chicago Title | |
| Csukas Edwin | $296,000 | -- | |
| Henry Amanda | $160,822 | James Carlucci | |
| Henry Amanda | $155,000 | James Esq Carlucci | |
| Jenjack Productions Inc P Rofit Sharing Plan | $115,000 | Richard M Koweek |
Source: Public Records
Mortgage History
| Date | Status | Borrower | Loan Amount |
|---|---|---|---|
| Previous Owner | Csukas Edwin | $281,000 |
Source: Public Records
Tax History
| Year | Tax Paid | Tax Assessment Tax Assessment Total Assessment is a certain percentage of the fair market value that is determined by local assessors to be the total taxable value of land and additions on the property. | Land | Improvement |
|---|---|---|---|---|
| 2024 | $6,837 | $320,000 | $24,500 | $295,500 |
| 2023 | $5,732 | $320,000 | $24,500 | $295,500 |
| 2022 | $5,606 | $320,000 | $24,500 | $295,500 |
| 2021 | $5,467 | $320,000 | $24,500 | $295,500 |
| 2020 | $5,254 | $296,000 | $24,500 | $271,500 |
| 2019 | $4,106 | $296,000 | $24,500 | $271,500 |
| 2018 | $4,106 | $204,000 | $24,500 | $179,500 |
| 2017 | $3,780 | $204,000 | $24,500 | $179,500 |
| 2016 | $2,293 | $159,000 | $24,500 | $134,500 |
| 2015 | -- | $159,000 | $24,500 | $134,500 |
| 2014 | -- | $159,000 | $24,500 | $134,500 |
Source: Public Records
Map
Nearby Homes
- 59 Allen St
- 218 Tanners Ln
- 238 Allen St
- 208 Warren St
- 75-77 S 3rd St
- 225 1/2 Columbia St
- 233 Columbia St
- 225 State St Unit Right
- 314 Warren St
- 213 Robinson St
- 222-224 Robinson St
- 356 Union St
- 315 State St
- 411 Warren St
- 420 Warren St
- 446 E Allen St
- 434 Warren St
- 452 Columbia St Unit D
- 438 Carroll St
- 402 Washington St
Your Personal Tour Guide
Ask me questions while you tour the home.