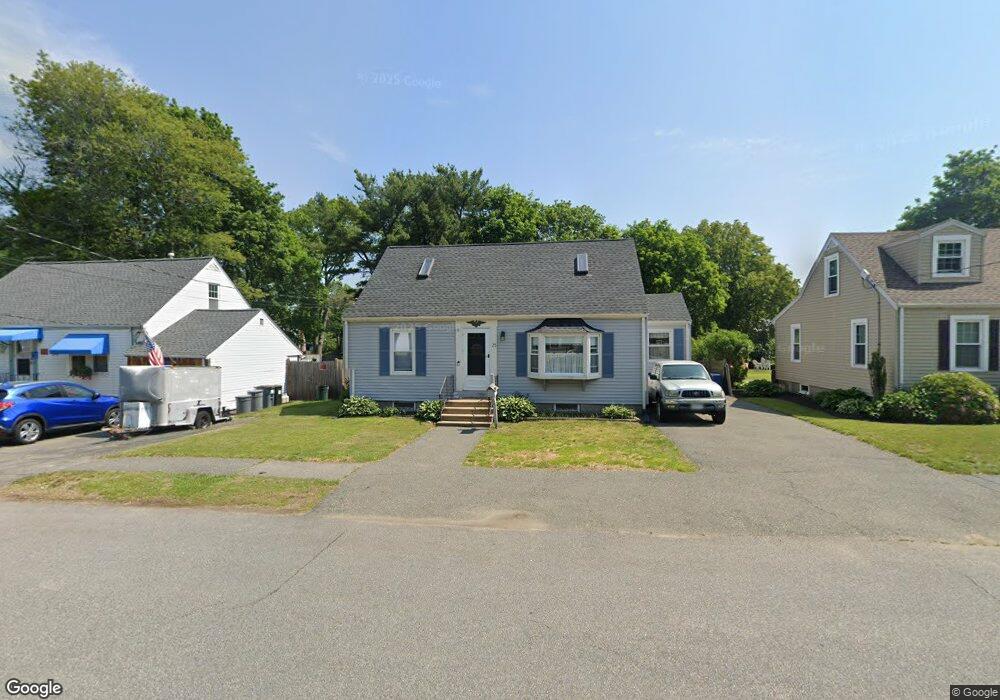
25 Dexter St Peabody, MA 01960
South Peabody NeighborhoodEstimated Value: $694,000 - $785,000
4
Beds
2
Baths
2,102
Sq Ft
$350/Sq Ft
Est. Value
About This Home
This home is located at 25 Dexter St, Peabody, MA 01960 and is currently estimated at $735,628, approximately $349 per square foot. 25 Dexter St is a home located in Essex County with nearby schools including Peabody Veterans Memorial High School, St John The Baptist School, and North Shore Christian School.
Ownership History
Date
Name
Owned For
Owner Type
Purchase Details
Closed on
May 29, 1992
Sold by
Meagher Phyllis M
Bought by
Meagher Sean P and Meagher Karen A
Current Estimated Value
Home Financials for this Owner
Home Financials are based on the most recent Mortgage that was taken out on this home.
Original Mortgage
$100,000
Interest Rate
8.7%
Mortgage Type
Purchase Money Mortgage
Create a Home Valuation Report for This Property
The Home Valuation Report is an in-depth analysis detailing your home's value as well as a comparison with similar homes in the area
Home Values in the Area
Average Home Value in this Area
Purchase History
| Date | Buyer | Sale Price | Title Company |
|---|---|---|---|
| Meagher Sean P | $125,000 | -- |
Source: Public Records
Mortgage History
| Date | Status | Borrower | Loan Amount |
|---|---|---|---|
| Open | Meagher Sean P | $135,000 | |
| Closed | Meagher Sean P | $130,000 | |
| Closed | Meagher Sean P | $100,000 |
Source: Public Records
Tax History
| Year | Tax Paid | Tax Assessment Tax Assessment Total Assessment is a certain percentage of the fair market value that is determined by local assessors to be the total taxable value of land and additions on the property. | Land | Improvement |
|---|---|---|---|---|
| 2025 | $5,998 | $647,700 | $240,600 | $407,100 |
| 2024 | $5,459 | $598,600 | $240,600 | $358,000 |
| 2023 | $5,180 | $544,100 | $214,800 | $329,300 |
| 2022 | $5,029 | $497,900 | $191,900 | $306,000 |
| 2021 | $4,731 | $451,000 | $174,400 | $276,600 |
| 2020 | $4,713 | $438,800 | $174,400 | $264,400 |
| 2019 | $4,699 | $426,800 | $174,400 | $252,400 |
| 2018 | $4,546 | $396,700 | $158,600 | $238,100 |
| 2017 | $4,294 | $365,100 | $158,600 | $206,500 |
| 2016 | $4,449 | $373,200 | $158,600 | $214,600 |
| 2015 | $4,022 | $327,000 | $154,600 | $172,400 |
Source: Public Records
Map
Nearby Homes
- 6 Allen Rd
- 26 Bartholomew Terrace
- 12 Tara Rd
- 38 Longview Way
- 3 Margaret Rd
- 43 Gedney Dr
- 11 Pulver Dr
- 111 Den Quarry Rd
- 21 Oak Leaf Way
- 22 Strongwater Dr
- 18 Strongwater Dr
- 11 Strongwater Dr
- 30 Longwood Rd
- 325 Den Quarry Rd
- 217 Cedar Brook Rd
- 333 Lynnfield St
- 54 Harris Rd
- 15 Swampscott Ave
- 9 Sutcliffe Rd
- 275 Lynnfield St Unit 275
Your Personal Tour Guide
Ask me questions while you tour the home.