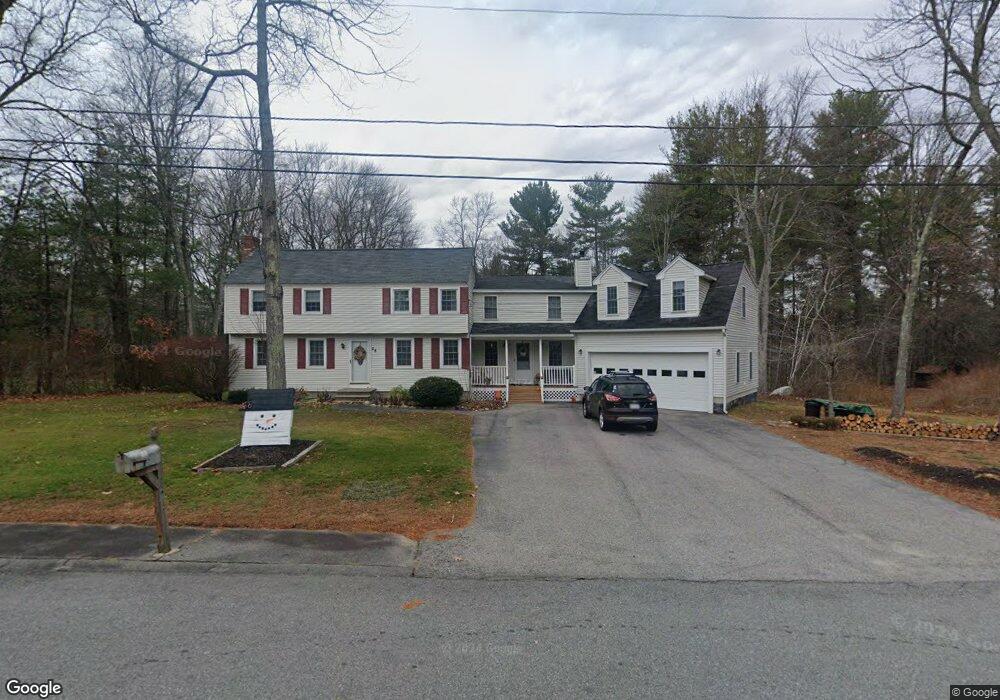
25 Douglas Rd Dracut, MA 01826
Estimated Value: $703,000 - $881,000
4
Beds
2
Baths
1,764
Sq Ft
$430/Sq Ft
Est. Value
About This Home
This home is located at 25 Douglas Rd, Dracut, MA 01826 and is currently estimated at $757,767, approximately $429 per square foot. 25 Douglas Rd is a home located in Middlesex County with nearby schools including Joseph A. Campbell Elementary School, Richardson Middle School, and Dracut Senior High School.
Ownership History
Date
Name
Owned For
Owner Type
Purchase Details
Closed on
Jul 31, 1997
Sold by
Saba John A and Saba Debra L
Bought by
Oshea David C and Oshea Francine D
Current Estimated Value
Purchase Details
Closed on
Apr 1, 1987
Sold by
Perregauz Edmond A
Bought by
Saba John
Create a Home Valuation Report for This Property
The Home Valuation Report is an in-depth analysis detailing your home's value as well as a comparison with similar homes in the area
Home Values in the Area
Average Home Value in this Area
Purchase History
| Date | Buyer | Sale Price | Title Company |
|---|---|---|---|
| Oshea David C | $156,500 | -- | |
| Saba John | $169,000 | -- |
Source: Public Records
Mortgage History
| Date | Status | Borrower | Loan Amount |
|---|---|---|---|
| Open | Saba John | $115,000 | |
| Closed | Saba John | $35,000 | |
| Closed | Saba John | $39,000 |
Source: Public Records
Tax History Compared to Growth
Tax History
| Year | Tax Paid | Tax Assessment Tax Assessment Total Assessment is a certain percentage of the fair market value that is determined by local assessors to be the total taxable value of land and additions on the property. | Land | Improvement |
|---|---|---|---|---|
| 2025 | $6,571 | $649,300 | $231,300 | $418,000 |
| 2024 | $6,311 | $603,900 | $220,500 | $383,400 |
| 2023 | $6,257 | $540,300 | $191,800 | $348,500 |
| 2022 | $6,154 | $500,700 | $174,600 | $326,100 |
| 2021 | $5,934 | $456,100 | $158,600 | $297,500 |
| 2020 | $5,732 | $429,400 | $153,900 | $275,500 |
| 2019 | $5,470 | $397,800 | $146,500 | $251,300 |
| 2018 | $7,466 | $386,800 | $146,500 | $240,300 |
| 2017 | $5,567 | $386,800 | $146,500 | $240,300 |
| 2016 | $5,504 | $370,900 | $147,300 | $223,600 |
| 2015 | $5,297 | $354,800 | $147,300 | $207,500 |
| 2014 | $4,940 | $340,900 | $147,300 | $193,600 |
Source: Public Records
Map
Nearby Homes