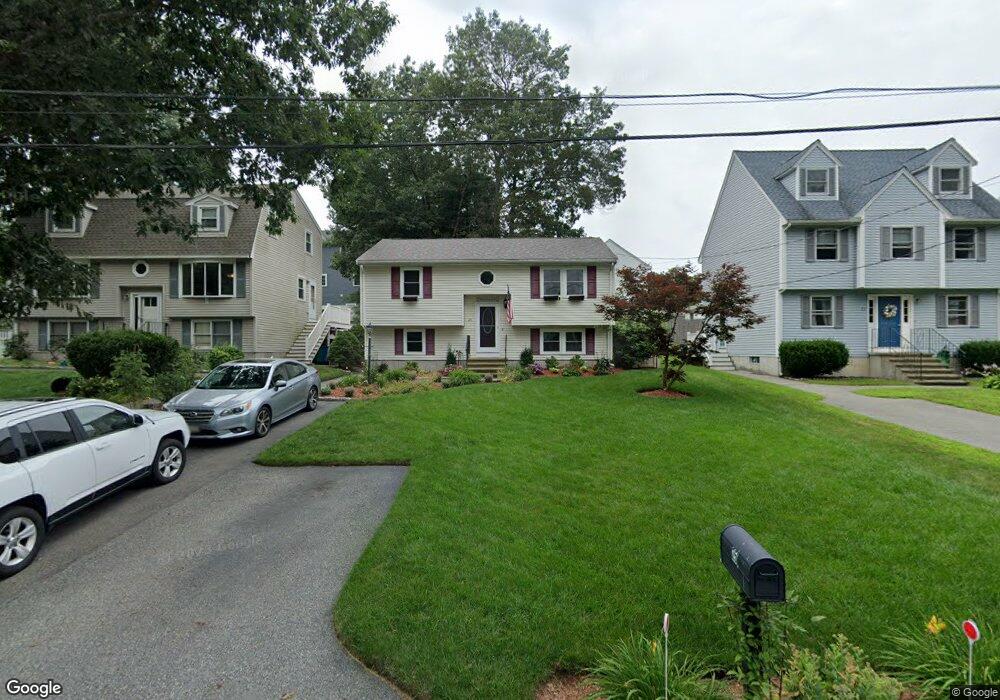
25 Duncan Dr Billerica, MA 01821
Pinehurst NeighborhoodEstimated Value: $622,000 - $677,000
3
Beds
2
Baths
1,760
Sq Ft
$373/Sq Ft
Est. Value
About This Home
This home is located at 25 Duncan Dr, Billerica, MA 01821 and is currently estimated at $656,765, approximately $373 per square foot. 25 Duncan Dr is a home located in Middlesex County with nearby schools including Billerica Memorial High School, Mount Hope Christian School, and Burlington Montessori School.
Ownership History
Date
Name
Owned For
Owner Type
Purchase Details
Closed on
May 17, 2024
Sold by
Kelloway David and Brennan Terese
Bought by
Lenny T T and Lenny Kelloway
Current Estimated Value
Purchase Details
Closed on
Jan 7, 2008
Sold by
Brennan Terese
Bought by
Kelloway David and Brennan Terese
Home Financials for this Owner
Home Financials are based on the most recent Mortgage that was taken out on this home.
Original Mortgage
$279,000
Interest Rate
6.27%
Mortgage Type
Purchase Money Mortgage
Purchase Details
Closed on
Sep 2, 2003
Sold by
Centola Bethanne and Centola Christopher G
Bought by
Brennan Terese
Purchase Details
Closed on
Jan 24, 1994
Sold by
Murphy and Murphy Robert E
Bought by
Centola Christopher and Centola Bethanne
Create a Home Valuation Report for This Property
The Home Valuation Report is an in-depth analysis detailing your home's value as well as a comparison with similar homes in the area
Home Values in the Area
Average Home Value in this Area
Purchase History
| Date | Buyer | Sale Price | Title Company |
|---|---|---|---|
| Lenny T T | -- | None Available | |
| Lenny T T | -- | None Available | |
| Kelloway David | -- | -- | |
| Kelloway David | -- | -- | |
| Kelloway David | -- | -- | |
| Brennan Terese | $315,500 | -- | |
| Brennan Terese | $315,500 | -- | |
| Centola Christopher | $130,800 | -- | |
| Centola Christopher | $130,800 | -- |
Source: Public Records
Mortgage History
| Date | Status | Borrower | Loan Amount |
|---|---|---|---|
| Previous Owner | Centola Christopher | $269,000 | |
| Previous Owner | Kelloway David | $279,000 |
Source: Public Records
Tax History Compared to Growth
Tax History
| Year | Tax Paid | Tax Assessment Tax Assessment Total Assessment is a certain percentage of the fair market value that is determined by local assessors to be the total taxable value of land and additions on the property. | Land | Improvement |
|---|---|---|---|---|
| 2025 | $5,864 | $515,700 | $263,100 | $252,600 |
| 2024 | $5,497 | $486,900 | $257,600 | $229,300 |
| 2023 | $5,292 | $445,800 | $225,500 | $220,300 |
| 2022 | $4,804 | $380,100 | $188,200 | $191,900 |
| 2021 | $4,614 | $354,900 | $169,000 | $185,900 |
| 2020 | $4,523 | $348,200 | $162,300 | $185,900 |
| 2019 | $4,471 | $331,700 | $159,300 | $172,400 |
| 2018 | $4,376 | $308,400 | $150,300 | $158,100 |
| 2017 | $3,992 | $283,300 | $141,300 | $142,000 |
| 2016 | $3,921 | $277,300 | $135,300 | $142,000 |
| 2015 | $3,886 | $276,800 | $135,300 | $141,500 |
| 2014 | $3,860 | $270,100 | $125,700 | $144,400 |
Source: Public Records
Map
Nearby Homes