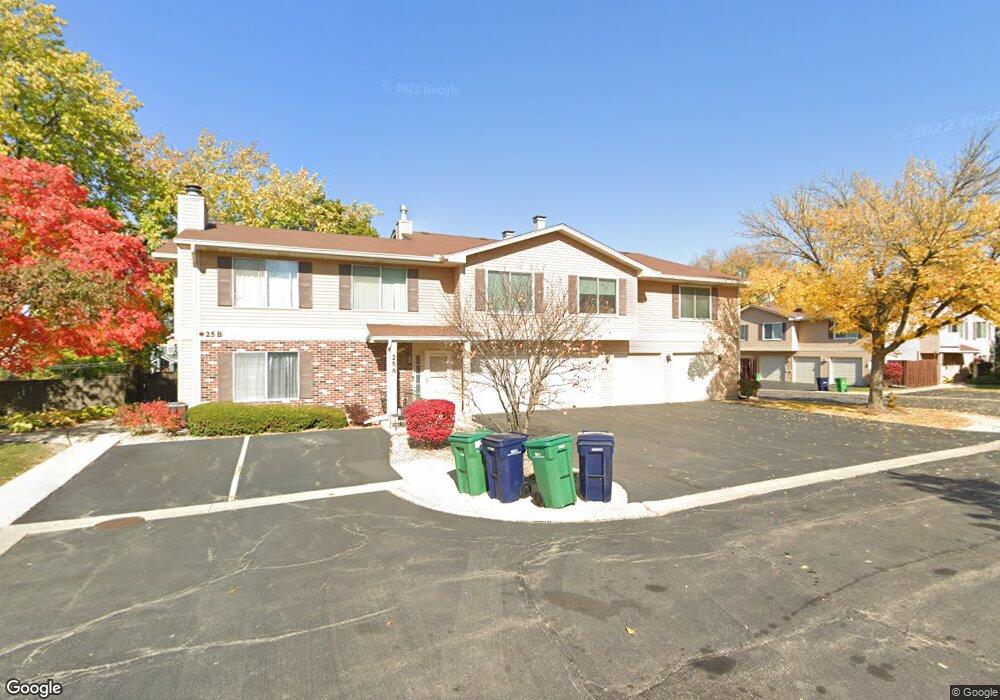
25 E Hickory St Unit 7A Lombard, IL 60148
North Lombard NeighborhoodEstimated Value: $278,159 - $293,000
Studio
--
Bath
1,165
Sq Ft
$245/Sq Ft
Est. Value
About This Home
This home is located at 25 E Hickory St Unit 7A, Lombard, IL 60148 and is currently estimated at $285,540, approximately $245 per square foot. 25 E Hickory St Unit 7A is a home located in DuPage County with nearby schools including Wm Hammerschmidt Elementary School, Glenn Westlake Middle School, and Glenbard East High School.
Ownership History
Date
Name
Owned For
Owner Type
Purchase Details
Closed on
Jun 29, 2016
Sold by
Junta Deborah and Schraag Pamela
Bought by
Baskin Katrina L
Current Estimated Value
Home Financials for this Owner
Home Financials are based on the most recent Mortgage that was taken out on this home.
Original Mortgage
$161,990
Outstanding Balance
$131,520
Interest Rate
4.12%
Mortgage Type
New Conventional
Estimated Equity
$154,020
Purchase Details
Closed on
Oct 18, 2000
Sold by
Schmidke Darlyne
Bought by
Darlyne Schmidke Revocable Living Trust
Purchase Details
Closed on
Sep 15, 1998
Sold by
Bank One Trust Company Na
Bought by
Schmidke Edmund and Schmidke Darlyne
Home Financials for this Owner
Home Financials are based on the most recent Mortgage that was taken out on this home.
Original Mortgage
$127,000
Interest Rate
6.97%
Mortgage Type
Purchase Money Mortgage
Create a Home Valuation Report for This Property
The Home Valuation Report is an in-depth analysis detailing your home's value as well as a comparison with similar homes in the area
Home Values in the Area
Average Home Value in this Area
Purchase History
| Date | Buyer | Sale Price | Title Company |
|---|---|---|---|
| Baskin Katrina L | $167,000 | Ctc Dupage | |
| Darlyne Schmidke Revocable Living Trust | -- | -- | |
| Schmidke Edmund | $125,000 | -- |
Source: Public Records
Mortgage History
| Date | Status | Borrower | Loan Amount |
|---|---|---|---|
| Open | Baskin Katrina L | $161,990 | |
| Previous Owner | Schmidke Edmund | $127,000 |
Source: Public Records
Tax History Compared to Growth
Tax History
| Year | Tax Paid | Tax Assessment Tax Assessment Total Assessment is a certain percentage of the fair market value that is determined by local assessors to be the total taxable value of land and additions on the property. | Land | Improvement |
|---|---|---|---|---|
| 2024 | $5,275 | $75,892 | $7,591 | $68,301 |
| 2023 | $5,000 | $70,180 | $7,020 | $63,160 |
| 2022 | $4,662 | $64,420 | $6,440 | $57,980 |
| 2021 | $4,511 | $62,820 | $6,280 | $56,540 |
| 2020 | $4,412 | $61,440 | $6,140 | $55,300 |
| 2019 | $4,182 | $58,420 | $5,840 | $52,580 |
| 2018 | $3,813 | $51,940 | $5,240 | $46,700 |
| 2017 | $3,419 | $46,250 | $4,660 | $41,590 |
| 2016 | $3,309 | $43,570 | $4,390 | $39,180 |
| 2015 | $3,107 | $40,590 | $4,090 | $36,500 |
| 2014 | $3,203 | $45,620 | $4,590 | $41,030 |
| 2013 | $3,165 | $46,260 | $4,650 | $41,610 |
Source: Public Records
Map
Nearby Homes
- 31 E Washington Blvd
- 324 S Main St
- 310 S Main St Unit 314
- 250 St Regis
- 591 S Park Rd
- 1 S Lincoln Ave Unit 206
- 145 W Park Dr
- 416 E North Broadway St
- 314 E Elm St
- 16 N Garfield St Unit 2L
- 16 N Garfield St Unit 2E
- 43 S Craig Place
- 405 S Fairfield Ave
- 218 S Fairfield Ave
- 33 N Main St Unit 2E
- 31 W Harrison Rd
- 26 N Craig Place
- 826 S Main St
- 16 W Taylor Rd
- 22 W Graham Ave
- 25 E Hickory St Unit B
- 25 E Hickory St Unit D
- 25 E Hickory St Unit 703
- 25 E Hickory St Unit C
- 25 E Hickory St Unit A
- 25 E Hickory St
- 27 E Hickory St Unit D
- 27 E Hickory St Unit 4D
- 37 E Hickory St Unit D
- 33 E Hickory St Unit D
- 35 E Hickory St Unit 203
- 29 E Hickory St Unit 504
- 23 E Hickory St Unit 801
- 23 E Hickory St Unit B
- 35 E Hickory St Unit 204
- 35 E Hickory St Unit 201
- 27 E Hickory St Unit 27B
- 35 E Hickory St Unit 202
- 33 E Hickory St Unit 301
- 37 E Hickory St Unit A