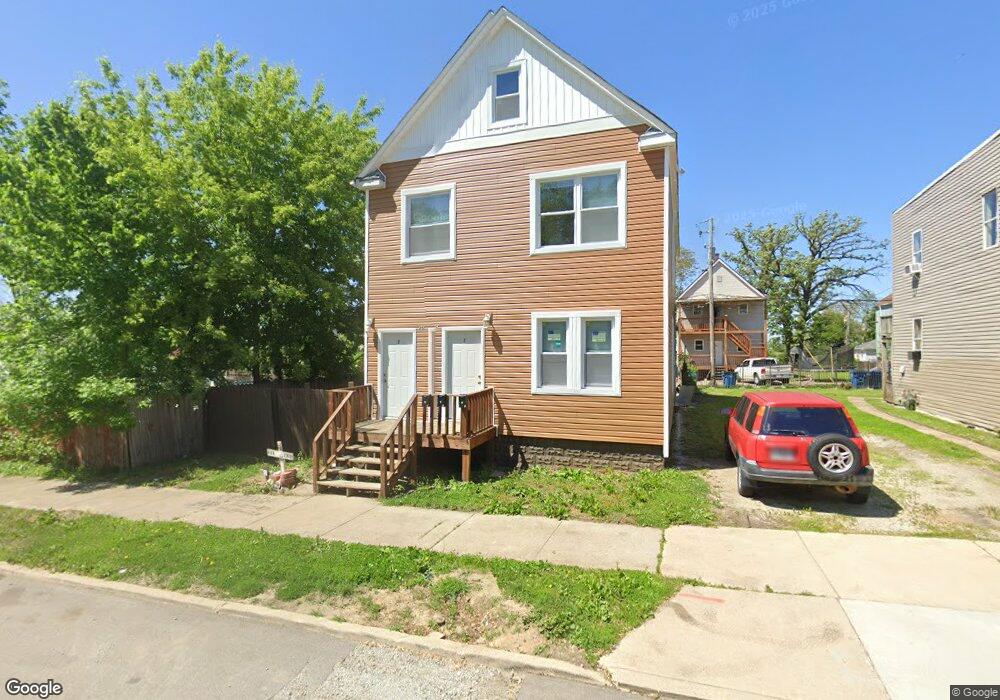
25 E Main St Chicago Heights, IL 60411
Hungry Hill NeighborhoodEstimated Value: $63,000 - $223,000
6
Beds
2
Baths
--
Sq Ft
19,602
Sq Ft
About This Home
This home is located at 25 E Main St, Chicago Heights, IL 60411 and is currently estimated at $151,333. 25 E Main St is a home located in Cook County with nearby schools including Washington-Mckinley Elementary School, Bloom High School, and St Agnes School.
Ownership History
Date
Name
Owned For
Owner Type
Purchase Details
Closed on
Dec 20, 2023
Sold by
City Of Chicago Heights
Bought by
Flores Annette
Current Estimated Value
Purchase Details
Closed on
Jun 12, 2023
Sold by
Bey Antonio Garcia
Bought by
City Of Chicago Heights
Purchase Details
Closed on
Feb 5, 2011
Sold by
Minotti Joseph
Bought by
Bey Antonio Garcia
Purchase Details
Closed on
Oct 13, 2010
Sold by
First Community Bank & Trust
Bought by
Minotti Joseph
Purchase Details
Closed on
Dec 29, 2009
Sold by
First Community Bank & Trust
Bought by
First Community Bank & Trust and Trust #2008-0335
Purchase Details
Closed on
Aug 14, 2006
Sold by
Gurin Joan E
Bought by
First Community Bank & Trust and Trust #2000-0079
Home Financials for this Owner
Home Financials are based on the most recent Mortgage that was taken out on this home.
Original Mortgage
$40,000
Interest Rate
6.78%
Mortgage Type
Purchase Money Mortgage
Create a Home Valuation Report for This Property
The Home Valuation Report is an in-depth analysis detailing your home's value as well as a comparison with similar homes in the area
Home Values in the Area
Average Home Value in this Area
Purchase History
| Date | Buyer | Sale Price | Title Company |
|---|---|---|---|
| Flores Annette | -- | None Listed On Document | |
| City Of Chicago Heights | -- | None Listed On Document | |
| Bey Antonio Garcia | -- | Fidelity Natl Title Ins Co | |
| Minotti Joseph | -- | None Available | |
| First Community Bank & Trust | -- | None Available | |
| First Community Bank & Trust | $40,000 | Pntn |
Source: Public Records
Mortgage History
| Date | Status | Borrower | Loan Amount |
|---|---|---|---|
| Previous Owner | First Community Bank & Trust | $40,000 |
Source: Public Records
Tax History
| Year | Tax Paid | Tax Assessment Tax Assessment Total Assessment is a certain percentage of the fair market value that is determined by local assessors to be the total taxable value of land and additions on the property. | Land | Improvement |
|---|---|---|---|---|
| 2025 | $393 | $741 | $741 | -- |
| 2024 | $393 | $741 | $741 | -- |
| 2023 | $374 | $741 | $741 | -- |
| 2022 | $374 | $593 | $593 | $0 |
| 2021 | $359 | $592 | $592 | $0 |
| 2020 | $348 | $592 | $592 | $0 |
| 2019 | $313 | $543 | $543 | $0 |
| 2018 | $297 | $543 | $543 | $0 |
| 2017 | $284 | $543 | $543 | $0 |
| 2016 | $264 | $493 | $493 | $0 |
| 2015 | $261 | $493 | $493 | $0 |
| 2014 | $259 | $493 | $493 | $0 |
| 2013 | $249 | $493 | $493 | $0 |
Source: Public Records
Map
Nearby Homes
Your Personal Tour Guide
Ask me questions while you tour the home.