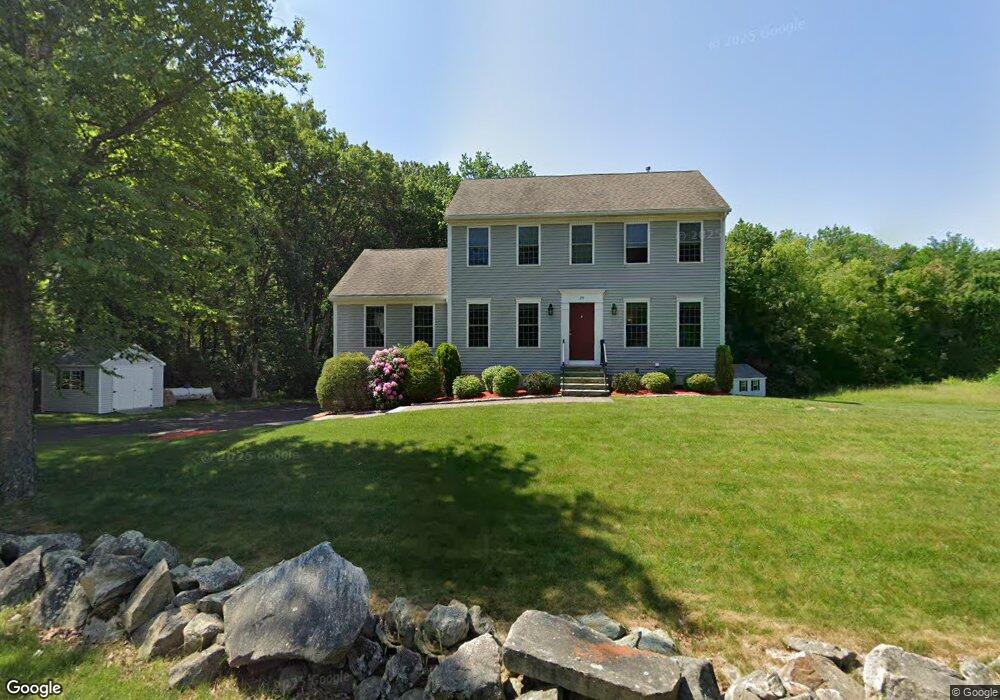
25 East St Unit LOT1 Uxbridge, MA 01569
Estimated Value: $671,000 - $823,000
3
Beds
4
Baths
2,545
Sq Ft
$286/Sq Ft
Est. Value
About This Home
This home is located at 25 East St Unit LOT1, Uxbridge, MA 01569 and is currently estimated at $727,798, approximately $285 per square foot. 25 East St Unit LOT1 is a home located in Worcester County with nearby schools including Uxbridge High School and Our Lady of the Valley Regional School.
Ownership History
Date
Name
Owned For
Owner Type
Purchase Details
Closed on
Jun 10, 2016
Sold by
Marshall Nancy A
Bought by
Marshall Nancy A and Chase Melodie
Current Estimated Value
Purchase Details
Closed on
Aug 9, 2012
Sold by
Audet Homes Inc
Bought by
Morris Nancy A
Home Financials for this Owner
Home Financials are based on the most recent Mortgage that was taken out on this home.
Original Mortgage
$256,000
Interest Rate
3.7%
Mortgage Type
New Conventional
Purchase Details
Closed on
May 9, 2011
Sold by
Brothers Louise D
Bought by
Audet Homes Inc
Create a Home Valuation Report for This Property
The Home Valuation Report is an in-depth analysis detailing your home's value as well as a comparison with similar homes in the area
Home Values in the Area
Average Home Value in this Area
Purchase History
| Date | Buyer | Sale Price | Title Company |
|---|---|---|---|
| Marshall Nancy A | -- | -- | |
| Morris Nancy A | $320,000 | -- | |
| Audet Homes Inc | $75,000 | -- |
Source: Public Records
Mortgage History
| Date | Status | Borrower | Loan Amount |
|---|---|---|---|
| Previous Owner | Morris Nancy A | $256,000 |
Source: Public Records
Tax History Compared to Growth
Tax History
| Year | Tax Paid | Tax Assessment Tax Assessment Total Assessment is a certain percentage of the fair market value that is determined by local assessors to be the total taxable value of land and additions on the property. | Land | Improvement |
|---|---|---|---|---|
| 2025 | $7,562 | $576,800 | $152,900 | $423,900 |
| 2024 | $7,199 | $557,200 | $145,100 | $412,100 |
| 2023 | $6,816 | $488,600 | $125,500 | $363,100 |
| 2022 | $6,144 | $405,300 | $109,800 | $295,500 |
| 2021 | $6,374 | $402,900 | $107,400 | $295,500 |
| 2020 | $6,410 | $382,900 | $105,900 | $277,000 |
| 2019 | $6,348 | $365,900 | $105,900 | $260,000 |
| 2018 | $5,809 | $338,300 | $105,900 | $232,400 |
| 2017 | $5,149 | $303,600 | $103,600 | $200,000 |
| 2016 | $5,313 | $302,400 | $95,000 | $207,400 |
| 2015 | $5,185 | $298,000 | $95,000 | $203,000 |
Source: Public Records
Map
Nearby Homes
- 85 East St
- 286 Blackstone St
- 23 Rifleman Way
- 53 Asylum St
- 346 Millville Rd
- 328 Millville Rd
- 37 Elizabeth St
- 107 Henry St
- 13A Asylum St
- 127 Old Millville Rd
- 129 Quaker Hwy Unit 6
- 24 Road Ahr
- 256 Mendon St
- 46 Pouts Ln Unit 46
- 12 Hickory Rd
- 119 Albee Rd
- 57 Kempton Rd
- The Contemporary Villager Plan at Patriot's Landing
- Karenrose Sunnery Plan at Patriot's Landing
- 24 Olde Canal Way Unit 24