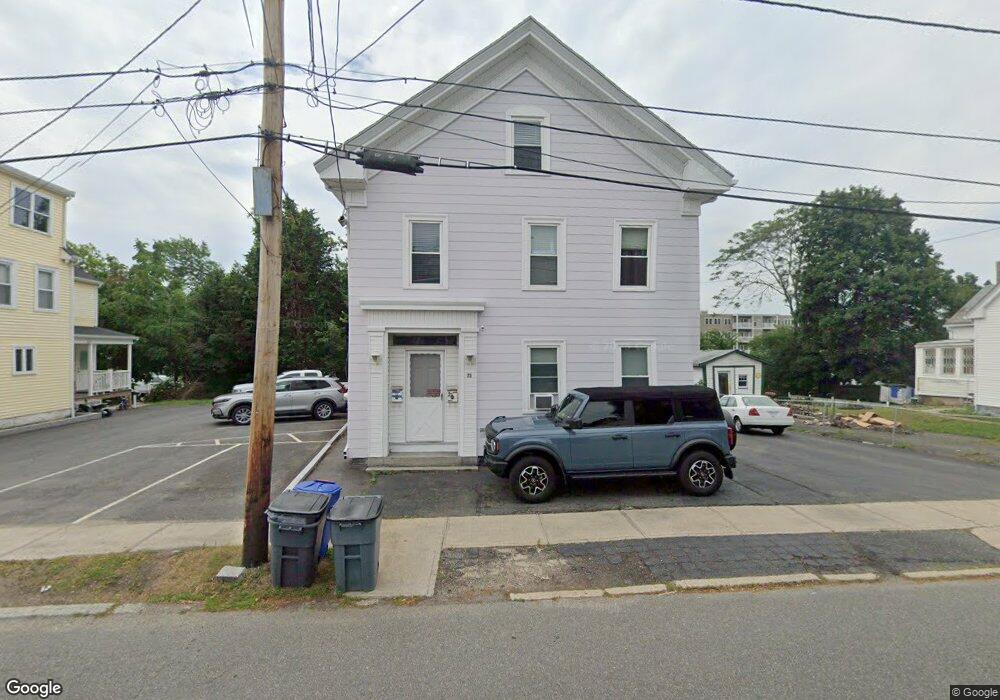
25 Elm St Peabody, MA 01960
Peabody Town Center NeighborhoodEstimated Value: $682,638 - $869,000
6
Beds
2
Baths
3,005
Sq Ft
$265/Sq Ft
Est. Value
About This Home
This home is located at 25 Elm St, Peabody, MA 01960 and is currently estimated at $795,910, approximately $264 per square foot. 25 Elm St is a home located in Essex County with nearby schools including Peabody Veterans Memorial High School, St John The Baptist School, and The Phoenix School.
Ownership History
Date
Name
Owned For
Owner Type
Purchase Details
Closed on
Nov 26, 2024
Sold by
Murphy Kerri A
Bought by
Murphy Ft and Murphy
Current Estimated Value
Purchase Details
Closed on
May 15, 2024
Sold by
George K Arvanitides Irt and Murphy
Bought by
Murphy Kerri A
Purchase Details
Closed on
Oct 4, 2021
Sold by
Arvanitides Ft and Arvanitides
Bought by
Arvanitides George K
Create a Home Valuation Report for This Property
The Home Valuation Report is an in-depth analysis detailing your home's value as well as a comparison with similar homes in the area
Home Values in the Area
Average Home Value in this Area
Purchase History
| Date | Buyer | Sale Price | Title Company |
|---|---|---|---|
| Murphy Ft | -- | None Available | |
| Murphy Ft | -- | None Available | |
| Murphy Kerri A | -- | None Available | |
| Murphy Kerri A | -- | None Available | |
| Arvanitides George K | -- | None Available | |
| Arvanitides George K | -- | None Available | |
| Arvanitides George K | -- | None Available |
Source: Public Records
Tax History Compared to Growth
Tax History
| Year | Tax Paid | Tax Assessment Tax Assessment Total Assessment is a certain percentage of the fair market value that is determined by local assessors to be the total taxable value of land and additions on the property. | Land | Improvement |
|---|---|---|---|---|
| 2025 | $6,711 | $724,700 | $213,300 | $511,400 |
| 2024 | $6,616 | $725,400 | $213,300 | $512,100 |
| 2023 | $5,796 | $608,800 | $185,600 | $423,200 |
| 2022 | $5,558 | $550,300 | $165,700 | $384,600 |
| 2021 | $5,398 | $514,600 | $150,600 | $364,000 |
| 2020 | $4,902 | $456,400 | $150,600 | $305,800 |
| 2019 | $4,467 | $405,700 | $150,600 | $255,100 |
| 2018 | $4,016 | $350,400 | $142,100 | $208,300 |
| 2017 | $4,025 | $342,300 | $142,100 | $200,200 |
| 2016 | $3,668 | $307,700 | $142,100 | $165,600 |
| 2015 | $3,512 | $285,500 | $142,100 | $143,400 |
Source: Public Records
Map
Nearby Homes
- 26 Elm St
- 8 Walnut St Unit 209
- 46 Walnut St
- 4 Elm St Unit 3
- 4 Northend St
- 64 Foster St Unit 105
- 80 Foster St Unit 501
- 48 Franklin St
- 11 A Endicott St Unit 3
- 98 Foster St
- 111 Foster St Unit 401
- 111 Foster St Unit 416
- 2 Osborne St
- 27 Pulaski St
- 8 Newcastle Rd
- 145 Boston St
- 14 Margin St
- 36 Irving St Unit B
- 55 Butler St
- 13 State St