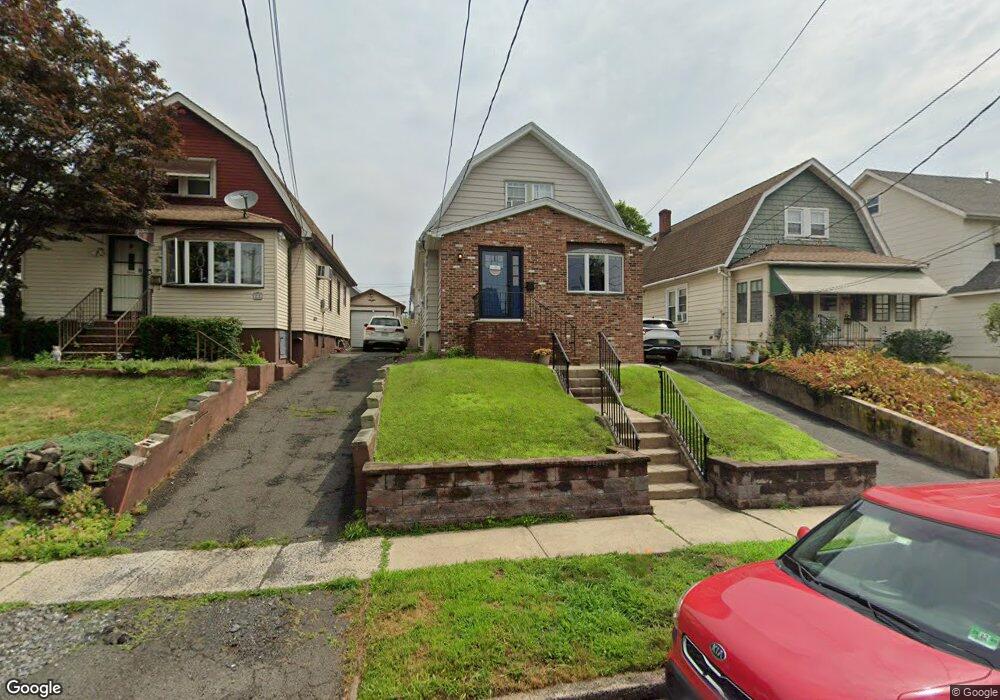
25 Elston St Bloomfield, NJ 07003
Estimated Value: $567,000 - $602,000
--
Bed
--
Bath
1,792
Sq Ft
$327/Sq Ft
Est. Value
About This Home
This home is located at 25 Elston St, Bloomfield, NJ 07003 and is currently estimated at $585,845, approximately $326 per square foot. 25 Elston St is a home located in Essex County with nearby schools including Demarest School, Bloomfield Middle School, and Bloomfield High School.
Ownership History
Date
Name
Owned For
Owner Type
Purchase Details
Closed on
Jun 13, 2006
Sold by
Engstromw John
Bought by
Rogers William and Rogers Linda
Current Estimated Value
Home Financials for this Owner
Home Financials are based on the most recent Mortgage that was taken out on this home.
Original Mortgage
$294,400
Outstanding Balance
$173,374
Interest Rate
6.6%
Mortgage Type
New Conventional
Estimated Equity
$412,471
Purchase Details
Closed on
May 17, 1989
Sold by
Lypowy Walter and Lypowy Deborah
Bought by
Potoczniak Margaret
Create a Home Valuation Report for This Property
The Home Valuation Report is an in-depth analysis detailing your home's value as well as a comparison with similar homes in the area
Home Values in the Area
Average Home Value in this Area
Purchase History
| Date | Buyer | Sale Price | Title Company |
|---|---|---|---|
| Rogers William | $368,000 | -- | |
| Potoczniak Margaret | $113,600 | -- |
Source: Public Records
Mortgage History
| Date | Status | Borrower | Loan Amount |
|---|---|---|---|
| Open | Rogers William | $294,400 |
Source: Public Records
Tax History Compared to Growth
Tax History
| Year | Tax Paid | Tax Assessment Tax Assessment Total Assessment is a certain percentage of the fair market value that is determined by local assessors to be the total taxable value of land and additions on the property. | Land | Improvement |
|---|---|---|---|---|
| 2025 | $11,657 | $356,700 | $129,200 | $227,500 |
| 2024 | $11,657 | $356,700 | $129,200 | $227,500 |
| 2022 | $11,422 | $356,700 | $129,200 | $227,500 |
| 2021 | $11,211 | $356,700 | $129,200 | $227,500 |
| 2020 | $11,040 | $356,700 | $129,200 | $227,500 |
| 2019 | $8,627 | $216,700 | $113,000 | $103,700 |
| 2018 | $8,590 | $216,700 | $113,000 | $103,700 |
| 2017 | $8,460 | $216,700 | $113,000 | $103,700 |
| 2016 | $8,365 | $216,700 | $113,000 | $103,700 |
| 2015 | $8,289 | $216,700 | $113,000 | $103,700 |
| 2014 | $8,137 | $216,700 | $113,000 | $103,700 |
Source: Public Records
Map
Nearby Homes