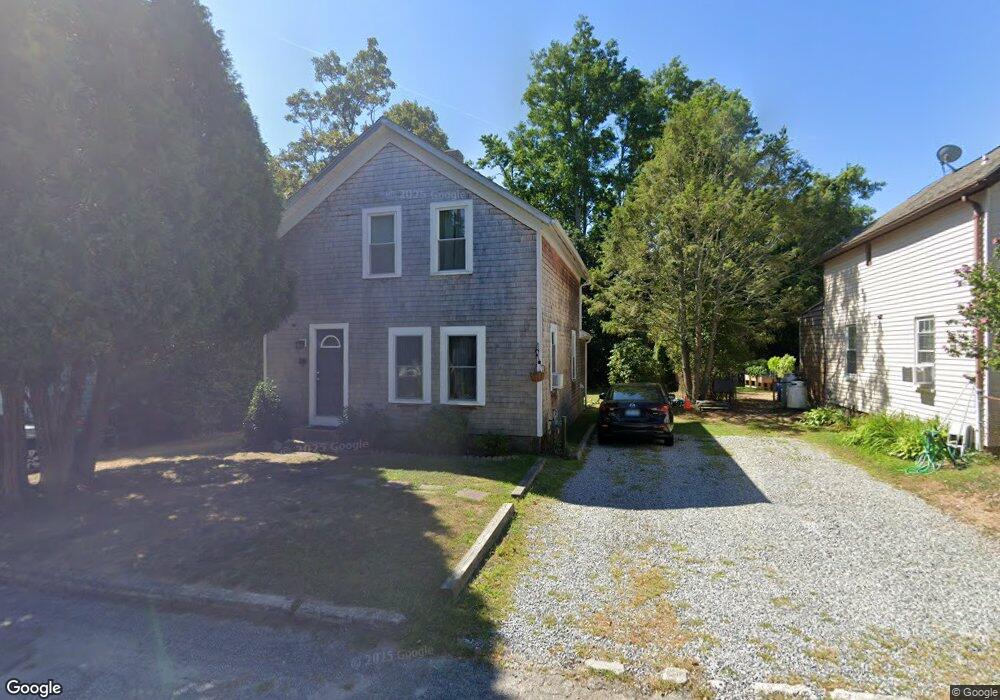
25 Fagan Ct Wakefield, RI 02879
Estimated Value: $424,000 - $498,000
3
Beds
2
Baths
986
Sq Ft
$457/Sq Ft
Est. Value
About This Home
This home is located at 25 Fagan Ct, Wakefield, RI 02879 and is currently estimated at $451,035, approximately $457 per square foot. 25 Fagan Ct is a home located in Washington County with nearby schools including South Kingstown High School, Monsignor Matthew Clarke Catholic Regional School, and South Shore School.
Ownership History
Date
Name
Owned For
Owner Type
Purchase Details
Closed on
Jul 12, 2021
Sold by
Robert D Fusaro T
Bought by
Brill Cayla A and Foley Tyler H
Current Estimated Value
Home Financials for this Owner
Home Financials are based on the most recent Mortgage that was taken out on this home.
Original Mortgage
$9,625
Outstanding Balance
$8,733
Interest Rate
2.9%
Mortgage Type
Purchase Money Mortgage
Estimated Equity
$442,302
Purchase Details
Closed on
Dec 20, 2012
Sold by
Fusaro Robert D
Bought by
Robert D Fusaro T and Fusaro Robert D
Purchase Details
Closed on
Aug 30, 1999
Sold by
Skaggs David L
Bought by
Fusaro Robert D
Home Financials for this Owner
Home Financials are based on the most recent Mortgage that was taken out on this home.
Original Mortgage
$57,880
Interest Rate
7.53%
Create a Home Valuation Report for This Property
The Home Valuation Report is an in-depth analysis detailing your home's value as well as a comparison with similar homes in the area
Home Values in the Area
Average Home Value in this Area
Purchase History
| Date | Buyer | Sale Price | Title Company |
|---|---|---|---|
| Brill Cayla A | $275,000 | None Available | |
| Robert D Fusaro T | -- | -- | |
| Fusaro Robert D | $72,500 | -- |
Source: Public Records
Mortgage History
| Date | Status | Borrower | Loan Amount |
|---|---|---|---|
| Open | Brill Cayla A | $9,625 | |
| Previous Owner | Fusaro Robert D | $57,880 |
Source: Public Records
Tax History Compared to Growth
Tax History
| Year | Tax Paid | Tax Assessment Tax Assessment Total Assessment is a certain percentage of the fair market value that is determined by local assessors to be the total taxable value of land and additions on the property. | Land | Improvement |
|---|---|---|---|---|
| 2025 | $2,910 | $325,500 | $147,900 | $177,600 |
| 2024 | $2,896 | $262,100 | $113,700 | $148,400 |
| 2023 | $2,896 | $262,100 | $113,700 | $148,400 |
| 2022 | $2,870 | $262,100 | $113,700 | $148,400 |
| 2021 | $2,825 | $195,500 | $93,700 | $101,800 |
| 2020 | $2,825 | $195,500 | $93,700 | $101,800 |
| 2019 | $2,825 | $195,500 | $93,700 | $101,800 |
| 2018 | $2,738 | $174,600 | $90,600 | $84,000 |
| 2017 | $2,673 | $174,600 | $90,600 | $84,000 |
| 2016 | $2,635 | $174,600 | $90,600 | $84,000 |
| 2015 | $2,569 | $165,500 | $85,200 | $80,300 |
| 2014 | $2,562 | $165,500 | $85,200 | $80,300 |
Source: Public Records
Map
Nearby Homes
- 48 Stone Bridge Dr
- 156 River St Unit B
- 128 Rodman St
- 3 Larkin St
- 31 Winter St
- 228 Rodman St
- 37 Columbia St
- 10 Hendricks St
- 40 Amos St
- 23 Rockland Dr
- 17 Celestial Heights Dr
- 128 North Rd
- 70 Broad Rock Rd
- 39 Hazard Ave
- 98 Meadow Ave
- 45 Cherry Ln Unit C
- 53 Rocky Brook Way
- 35 Whittier Dr
- 37 Whittier Dr
- 5 Secluded Dr