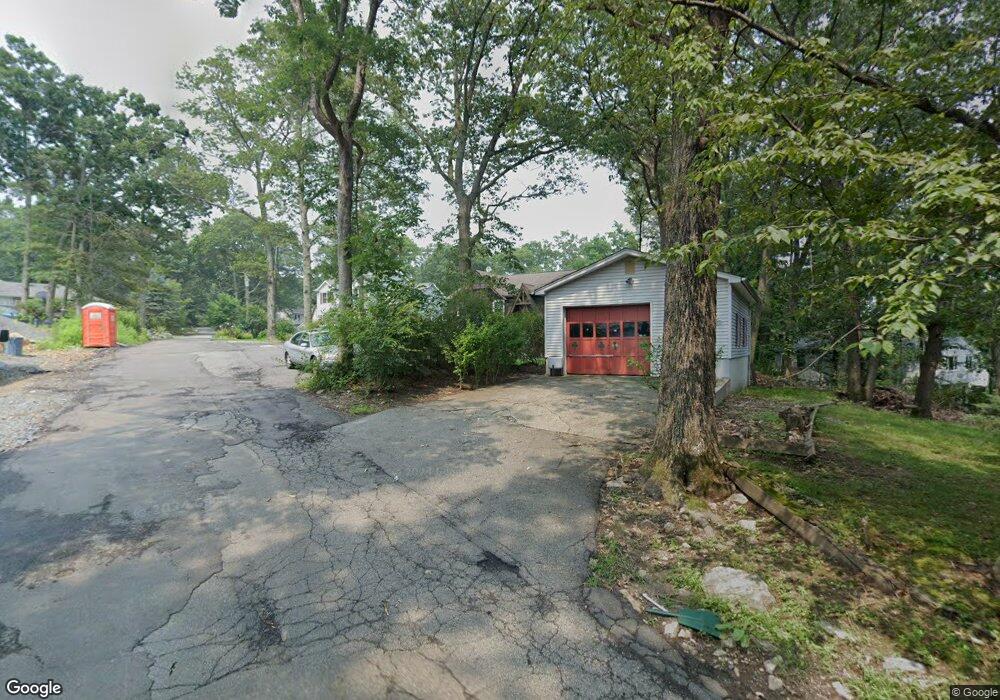
25 Fay Ave Stanhope, NJ 07874
Estimated Value: $478,000 - $496,481
--
Bed
--
Bath
1,748
Sq Ft
$280/Sq Ft
Est. Value
About This Home
This home is located at 25 Fay Ave, Stanhope, NJ 07874 and is currently estimated at $488,870, approximately $279 per square foot. 25 Fay Ave is a home located in Sussex County with nearby schools including Durban Avenue Elementary School, Hudson Maxim Elementary School, and Tulsa Trail Elementary School.
Ownership History
Date
Name
Owned For
Owner Type
Purchase Details
Closed on
Feb 26, 2001
Sold by
Reilly Mary Ellen T
Bought by
Certo Mark and Certo Michelle
Current Estimated Value
Home Financials for this Owner
Home Financials are based on the most recent Mortgage that was taken out on this home.
Original Mortgage
$163,445
Outstanding Balance
$59,470
Interest Rate
7.01%
Estimated Equity
$429,400
Create a Home Valuation Report for This Property
The Home Valuation Report is an in-depth analysis detailing your home's value as well as a comparison with similar homes in the area
Home Values in the Area
Average Home Value in this Area
Purchase History
| Date | Buyer | Sale Price | Title Company |
|---|---|---|---|
| Certo Mark | $168,500 | Ticor Title Insurance Compan |
Source: Public Records
Mortgage History
| Date | Status | Borrower | Loan Amount |
|---|---|---|---|
| Open | Certo Mark | $163,445 |
Source: Public Records
Tax History Compared to Growth
Tax History
| Year | Tax Paid | Tax Assessment Tax Assessment Total Assessment is a certain percentage of the fair market value that is determined by local assessors to be the total taxable value of land and additions on the property. | Land | Improvement |
|---|---|---|---|---|
| 2025 | $7,289 | $349,600 | $114,000 | $235,600 |
| 2024 | $7,407 | $349,600 | $114,000 | $235,600 |
| 2023 | $7,407 | $211,700 | $72,800 | $138,900 |
| 2022 | $7,261 | $211,700 | $72,800 | $138,900 |
| 2021 | $7,139 | $211,700 | $72,800 | $138,900 |
| 2020 | $7,064 | $211,700 | $72,800 | $138,900 |
| 2019 | $7,035 | $211,700 | $72,800 | $138,900 |
| 2018 | $7,020 | $211,700 | $72,800 | $138,900 |
| 2017 | $7,009 | $211,700 | $72,800 | $138,900 |
| 2016 | $7,024 | $211,700 | $72,800 | $138,900 |
| 2015 | $6,865 | $211,700 | $72,800 | $138,900 |
| 2014 | $6,842 | $211,700 | $72,800 | $138,900 |
Source: Public Records
Map
Nearby Homes