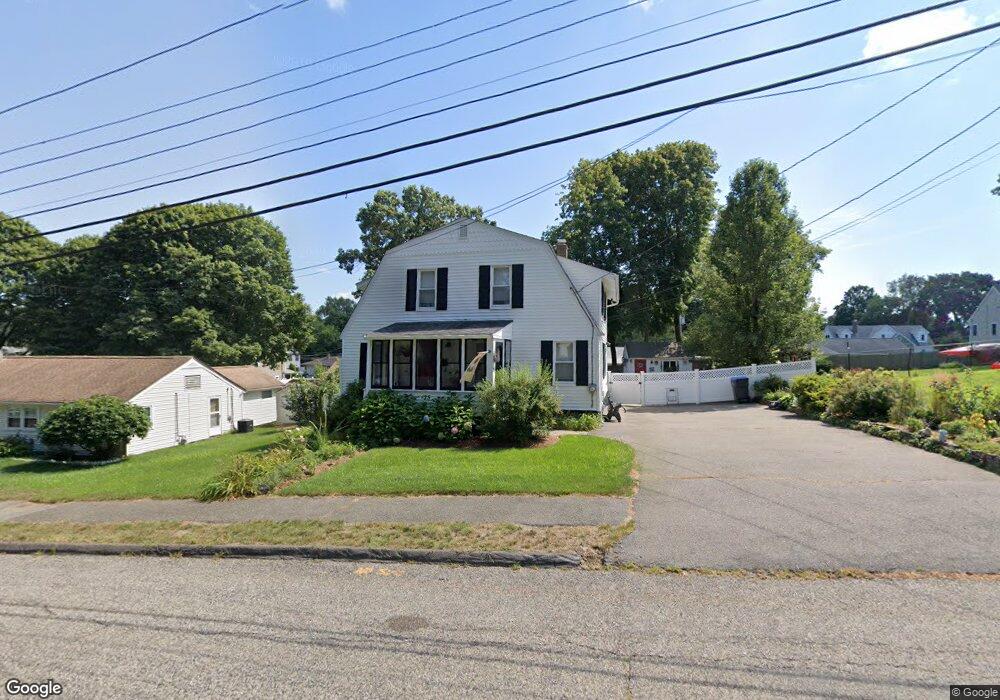
25 Felch Rd Natick, MA 01760
Estimated Value: $838,959 - $969,000
3
Beds
3
Baths
1,740
Sq Ft
$528/Sq Ft
Est. Value
About This Home
This home is located at 25 Felch Rd, Natick, MA 01760 and is currently estimated at $917,990, approximately $527 per square foot. 25 Felch Rd is a home located in Middlesex County with nearby schools including Natick High School, Bennett-Hemenway (Ben-Hem) Elementary School, and Wilson Middle School.
Ownership History
Date
Name
Owned For
Owner Type
Purchase Details
Closed on
Nov 2, 2018
Sold by
Cappola Patricia A
Bought by
Patricia A Capolla Lt
Current Estimated Value
Purchase Details
Closed on
Sep 17, 1991
Sold by
Gallerani Gallerani Jr Charles Jr Charles and Gallerani Alice M
Bought by
Cappola Patricia A
Home Financials for this Owner
Home Financials are based on the most recent Mortgage that was taken out on this home.
Original Mortgage
$128,000
Interest Rate
9.34%
Mortgage Type
Purchase Money Mortgage
Create a Home Valuation Report for This Property
The Home Valuation Report is an in-depth analysis detailing your home's value as well as a comparison with similar homes in the area
Home Values in the Area
Average Home Value in this Area
Purchase History
| Date | Buyer | Sale Price | Title Company |
|---|---|---|---|
| Patricia A Capolla Lt | -- | -- | |
| Cappola Patricia A | $160,000 | -- |
Source: Public Records
Mortgage History
| Date | Status | Borrower | Loan Amount |
|---|---|---|---|
| Previous Owner | Cappola Patricia A | $128,000 |
Source: Public Records
Tax History Compared to Growth
Tax History
| Year | Tax Paid | Tax Assessment Tax Assessment Total Assessment is a certain percentage of the fair market value that is determined by local assessors to be the total taxable value of land and additions on the property. | Land | Improvement |
|---|---|---|---|---|
| 2025 | $8,794 | $735,300 | $425,400 | $309,900 |
| 2024 | $8,478 | $691,500 | $400,400 | $291,100 |
| 2023 | $8,411 | $665,400 | $385,400 | $280,000 |
| 2022 | $8,056 | $603,900 | $350,300 | $253,600 |
| 2021 | $7,732 | $568,100 | $330,300 | $237,800 |
| 2020 | $7,528 | $553,100 | $315,300 | $237,800 |
| 2019 | $7,030 | $553,100 | $315,300 | $237,800 |
| 2018 | $6,898 | $528,600 | $300,200 | $228,400 |
| 2017 | $6,467 | $479,400 | $255,300 | $224,100 |
| 2016 | $6,192 | $456,300 | $234,300 | $222,000 |
| 2015 | $6,021 | $435,700 | $234,300 | $201,400 |
Source: Public Records
Map
Nearby Homes