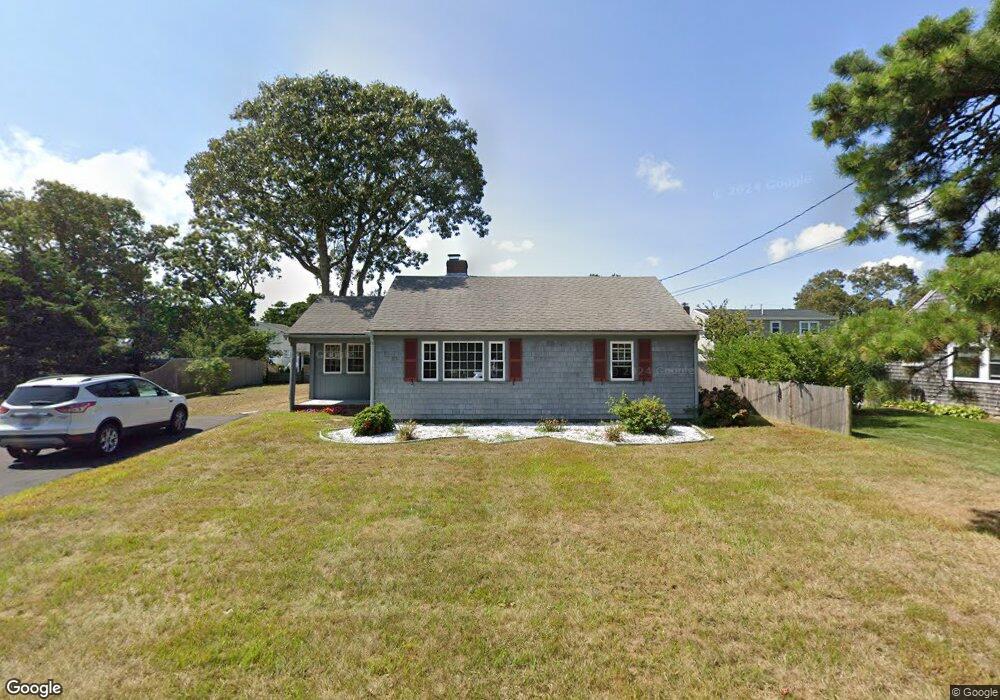
25 Fenway Rd Dennis Port, MA 02639
Dennis Port NeighborhoodEstimated Value: $505,000 - $681,000
2
Beds
1
Bath
800
Sq Ft
$768/Sq Ft
Est. Value
About This Home
This home is located at 25 Fenway Rd, Dennis Port, MA 02639 and is currently estimated at $614,720, approximately $768 per square foot. 25 Fenway Rd is a home located in Barnstable County with nearby schools including Dennis-Yarmouth Regional High School and St. Pius X. School.
Ownership History
Date
Name
Owned For
Owner Type
Purchase Details
Closed on
Jan 20, 2022
Sold by
Burke James M and Burke Bridget T
Bought by
Burke Ft and Walsh
Current Estimated Value
Purchase Details
Closed on
Jun 10, 1993
Sold by
Jones Walter R
Bought by
Burke James M and Burke Bridget T
Create a Home Valuation Report for This Property
The Home Valuation Report is an in-depth analysis detailing your home's value as well as a comparison with similar homes in the area
Home Values in the Area
Average Home Value in this Area
Purchase History
| Date | Buyer | Sale Price | Title Company |
|---|---|---|---|
| Burke Ft | -- | None Available | |
| Burke Ft | -- | None Available | |
| Burke James M | $107,500 | -- | |
| Burke James M | $107,500 | -- |
Source: Public Records
Tax History Compared to Growth
Tax History
| Year | Tax Paid | Tax Assessment Tax Assessment Total Assessment is a certain percentage of the fair market value that is determined by local assessors to be the total taxable value of land and additions on the property. | Land | Improvement |
|---|---|---|---|---|
| 2025 | $2,497 | $576,700 | $291,400 | $285,300 |
| 2024 | $2,350 | $535,200 | $280,200 | $255,000 |
| 2023 | $2,273 | $486,700 | $254,700 | $232,000 |
| 2022 | $2,101 | $375,200 | $200,800 | $174,400 |
| 2021 | $2,052 | $340,300 | $196,800 | $143,500 |
| 2020 | $1,995 | $327,000 | $196,800 | $130,200 |
| 2019 | $2,006 | $325,200 | $209,500 | $115,700 |
| 2018 | $1,932 | $304,700 | $199,500 | $105,200 |
| 2017 | $1,756 | $285,600 | $183,700 | $101,900 |
| 2016 | $1,693 | $259,300 | $173,200 | $86,100 |
| 2015 | $1,660 | $259,300 | $173,200 | $86,100 |
| 2014 | $1,580 | $248,800 | $162,700 | $86,100 |
Source: Public Records
Map
Nearby Homes
- 22 Ferncliff Rd
- 102 Sea St
- 37-A Beach Hills Rd
- 37 Beach Hills Rd
- 262 Old Wharf Rd Unit 67
- 262 Old Wharf Rd Unit 5
- 262 Old Wharf Rd Unit 5
- 262 Old Wharf Rd Unit 20
- 262 Old Wharf Rd Unit 87
- 402 Old Wharf Rd
- 402 Old Wharf Rd
- 405 Old Wharf Rd Unit B204
- 405 Old Wharf Rd Unit B204
- 241 Old Wharf Rd Unit 82
- 241 Old Wharf Rd Unit 127
- 241 Old Wharf Rd Unit 90
- 11 Ocean Park W
- 9 Chase Ave Unit 6
- 31 Easy St
- 217 Old Wharf Rd Unit 64
- 29 Fenway Rd
- 44 Ferncliff Rd
- 46 Ferncliff Rd
- 21 Fenway Rd
- 42 Ferncliff Rd
- 48 Ferncliff Rd
- 33 Fenway Rd
- 22 Fenway Rd
- 26 Fenway Rd
- 38 Ferncliff Rd
- 17 Fenway Rd
- 18 Fenway Rd
- 54 Ferncliff Rd
- 43 Ferncliff Rd
- 29 Arbor Way
- 29 Arbor Way Unit 29
- 25 Arbor Way
- 23 Arbor Way
- 25 Arbor Way Unit Kare
- 25 Arbor Way Unit 25