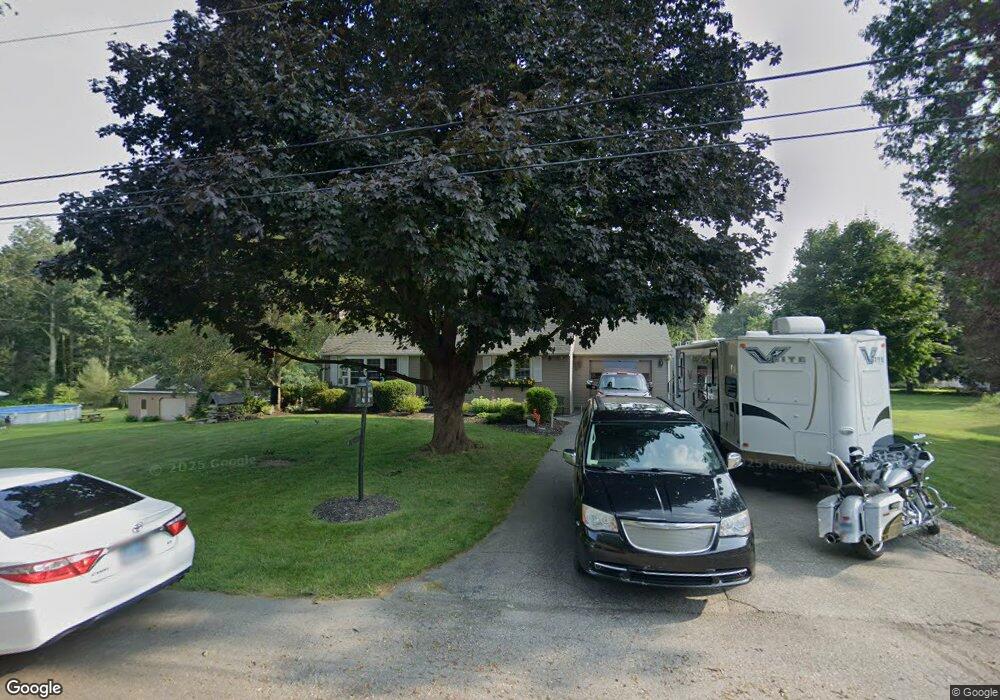
25 Foster St Danielson, CT 06239
Estimated Value: $367,000 - $394,000
3
Beds
2
Baths
1,052
Sq Ft
$366/Sq Ft
Est. Value
About This Home
This home is located at 25 Foster St, Danielson, CT 06239 and is currently estimated at $384,783, approximately $365 per square foot. 25 Foster St is a home located in Windham County with nearby schools including Killingly Central School, Killingly Memorial School, and Killingly Intermediate School.
Ownership History
Date
Name
Owned For
Owner Type
Purchase Details
Closed on
Jun 20, 2003
Sold by
Nottage Lori-Ann
Bought by
Manning Kevin J and Manning Tammy L
Current Estimated Value
Purchase Details
Closed on
Feb 1, 2001
Sold by
Hourigan William P and Hourigan Linda
Bought by
Nottage Lori Ann
Purchase Details
Closed on
Sep 8, 1998
Sold by
Rhodes Donald C and Rhodes Lillian B
Bought by
Hourigan William P and Hourigan Linda
Create a Home Valuation Report for This Property
The Home Valuation Report is an in-depth analysis detailing your home's value as well as a comparison with similar homes in the area
Home Values in the Area
Average Home Value in this Area
Purchase History
| Date | Buyer | Sale Price | Title Company |
|---|---|---|---|
| Manning Kevin J | $179,900 | -- | |
| Manning Kevin J | $179,900 | -- | |
| Nottage Lori Ann | $135,000 | -- | |
| Nottage Lori Ann | $135,000 | -- | |
| Hourigan William P | $126,000 | -- | |
| Hourigan William P | $126,000 | -- |
Source: Public Records
Mortgage History
| Date | Status | Borrower | Loan Amount |
|---|---|---|---|
| Open | Hourigan William P | $80,000 | |
| Open | Hourigan William P | $150,000 |
Source: Public Records
Tax History Compared to Growth
Tax History
| Year | Tax Paid | Tax Assessment Tax Assessment Total Assessment is a certain percentage of the fair market value that is determined by local assessors to be the total taxable value of land and additions on the property. | Land | Improvement |
|---|---|---|---|---|
| 2025 | $4,551 | $195,820 | $37,580 | $158,240 |
| 2024 | $4,330 | $195,820 | $37,580 | $158,240 |
| 2023 | $4,416 | $151,900 | $30,940 | $120,960 |
| 2022 | $4,151 | $151,900 | $30,940 | $120,960 |
| 2021 | $4,138 | $151,900 | $30,940 | $120,960 |
| 2020 | $4,062 | $151,900 | $30,940 | $120,960 |
| 2019 | $4,126 | $151,900 | $30,940 | $120,960 |
| 2017 | $3,519 | $122,570 | $23,940 | $98,630 |
| 2016 | $3,519 | $122,570 | $23,940 | $98,630 |
| 2015 | $3,519 | $122,570 | $23,940 | $98,630 |
| 2014 | $3,421 | $122,570 | $23,940 | $98,630 |
Source: Public Records
Map
Nearby Homes