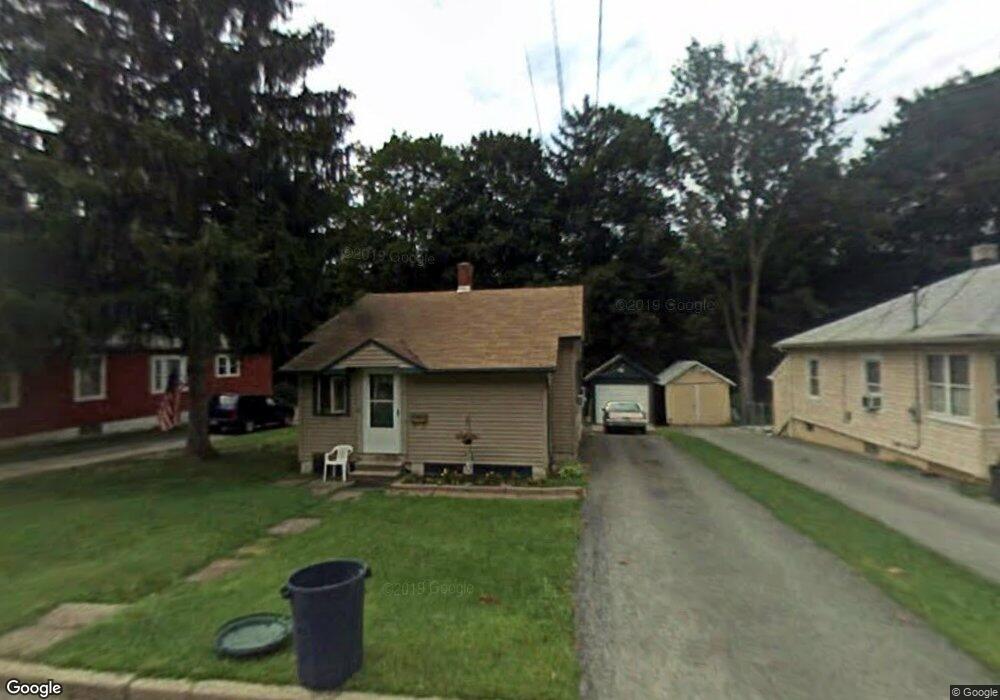
25 Fowler St Franklin, NJ 07416
Estimated Value: $281,352 - $328,000
--
Bed
--
Bath
854
Sq Ft
$358/Sq Ft
Est. Value
About This Home
This home is located at 25 Fowler St, Franklin, NJ 07416 and is currently estimated at $305,338, approximately $357 per square foot. 25 Fowler St is a home located in Sussex County with nearby schools including Franklin Elementary School, Wallkill Valley Regional High School, and Immaculate Conception Regional School.
Ownership History
Date
Name
Owned For
Owner Type
Purchase Details
Closed on
Apr 29, 1998
Sold by
Demarco Joseph A and Demarco Barbara A
Bought by
Vieira Vincent D and Vieira Sandra L
Current Estimated Value
Home Financials for this Owner
Home Financials are based on the most recent Mortgage that was taken out on this home.
Original Mortgage
$84,390
Outstanding Balance
$16,403
Interest Rate
7.04%
Estimated Equity
$288,935
Create a Home Valuation Report for This Property
The Home Valuation Report is an in-depth analysis detailing your home's value as well as a comparison with similar homes in the area
Home Values in the Area
Average Home Value in this Area
Purchase History
| Date | Buyer | Sale Price | Title Company |
|---|---|---|---|
| Vieira Vincent D | $87,000 | -- |
Source: Public Records
Mortgage History
| Date | Status | Borrower | Loan Amount |
|---|---|---|---|
| Open | Vieira Vincent D | $84,390 |
Source: Public Records
Tax History Compared to Growth
Tax History
| Year | Tax Paid | Tax Assessment Tax Assessment Total Assessment is a certain percentage of the fair market value that is determined by local assessors to be the total taxable value of land and additions on the property. | Land | Improvement |
|---|---|---|---|---|
| 2025 | $5,796 | $245,700 | $90,000 | $155,700 |
| 2024 | $5,748 | $218,400 | $68,600 | $149,800 |
| 2023 | $5,748 | $208,500 | $63,000 | $145,500 |
| 2022 | $5,371 | $127,100 | $56,700 | $70,400 |
| 2021 | $5,216 | $127,100 | $56,700 | $70,400 |
| 2020 | $5,052 | $127,100 | $56,700 | $70,400 |
| 2019 | $4,823 | $127,100 | $56,700 | $70,400 |
| 2018 | $4,742 | $127,100 | $56,700 | $70,400 |
| 2017 | $4,626 | $127,100 | $56,700 | $70,400 |
| 2016 | $4,526 | $127,100 | $56,700 | $70,400 |
| 2015 | $4,540 | $127,100 | $56,700 | $70,400 |
| 2014 | $4,424 | $127,100 | $56,700 | $70,400 |
Source: Public Records
Map
Nearby Homes
- 8 Fowler St Unit 10
- 26 Wyker Rd Unit A
- 26 Wyker Rd Unit 2207
- 65 Buckwheat Rd
- 112 Scott Rd
- 52 High St
- 65 Scott Rd
- 70 Davis Rd
- 309 Rutherford Ave
- 66 Nestor St
- 33 Maple Rd
- 7 Woodland Rd
- 76 Constitution Way Unit 76
- 76 Constitution Way Unit 534
- 12 Davis Rd
- 6 South St
- 23 Liberty Ln Unit W5
- 45 Ben Franklin Dr Unit T1
- 10 Hemlock Dr
- 20 High Point CI