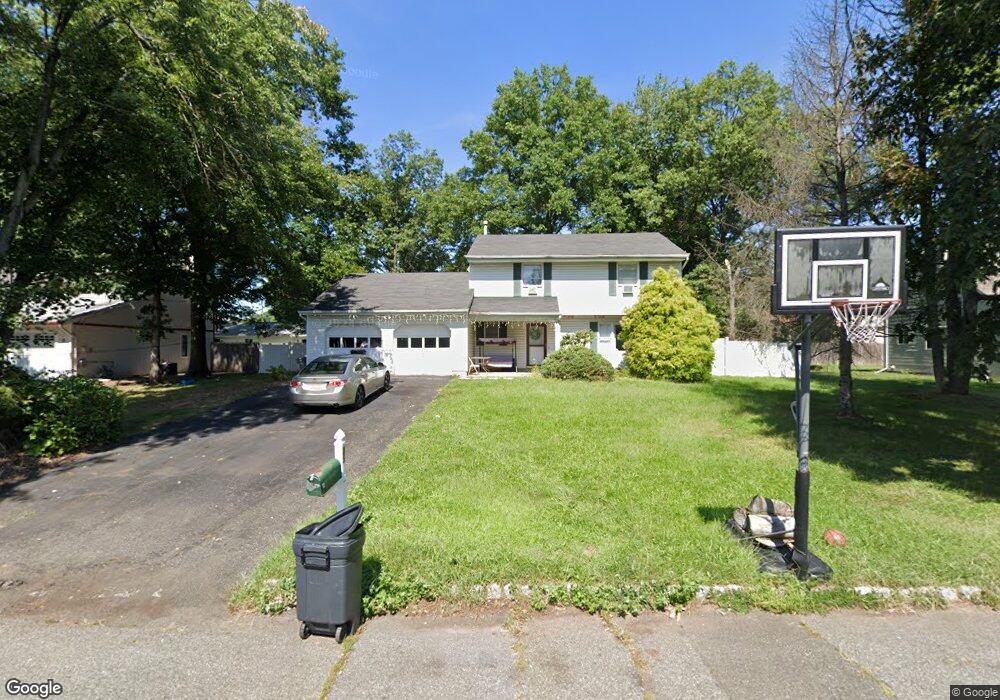
25 Gibson St Piscataway, NJ 08854
Estimated Value: $422,000 - $658,000
--
Bed
--
Bath
1,846
Sq Ft
$319/Sq Ft
Est. Value
About This Home
This home is located at 25 Gibson St, Piscataway, NJ 08854 and is currently estimated at $588,342, approximately $318 per square foot. 25 Gibson St is a home located in Middlesex County with nearby schools including Grandview Elementary School, Arbor Intermediate School, and Theodore Schor Middle School.
Ownership History
Date
Name
Owned For
Owner Type
Purchase Details
Closed on
Feb 28, 2020
Sold by
Xu Gang and Lu Xiaoling
Bought by
Chen Mei L and Fang Tina
Current Estimated Value
Home Financials for this Owner
Home Financials are based on the most recent Mortgage that was taken out on this home.
Original Mortgage
$200,000
Outstanding Balance
$138,495
Interest Rate
3.5%
Mortgage Type
New Conventional
Estimated Equity
$449,847
Purchase Details
Closed on
May 31, 2002
Sold by
Sitar Charles
Bought by
Xu Gang and Xiaoling Lu
Home Financials for this Owner
Home Financials are based on the most recent Mortgage that was taken out on this home.
Original Mortgage
$214,800
Interest Rate
6.92%
Create a Home Valuation Report for This Property
The Home Valuation Report is an in-depth analysis detailing your home's value as well as a comparison with similar homes in the area
Home Values in the Area
Average Home Value in this Area
Purchase History
| Date | Buyer | Sale Price | Title Company |
|---|---|---|---|
| Chen Mei L | $250,000 | Title Authority Llc | |
| Xu Gang | $268,500 | -- |
Source: Public Records
Mortgage History
| Date | Status | Borrower | Loan Amount |
|---|---|---|---|
| Open | Chen Mei L | $200,000 | |
| Previous Owner | Xu Gang | $214,800 |
Source: Public Records
Tax History Compared to Growth
Tax History
| Year | Tax Paid | Tax Assessment Tax Assessment Total Assessment is a certain percentage of the fair market value that is determined by local assessors to be the total taxable value of land and additions on the property. | Land | Improvement |
|---|---|---|---|---|
| 2025 | $8,201 | $471,800 | $260,400 | $211,400 |
| 2024 | $8,057 | $424,900 | $168,000 | $256,900 |
| 2023 | $8,057 | $390,000 | $168,000 | $222,000 |
| 2022 | $7,833 | $351,900 | $168,000 | $183,900 |
| 2021 | $6,951 | $370,800 | $168,000 | $202,800 |
| 2020 | $10,129 | $438,100 | $148,000 | $290,100 |
| 2019 | $7,374 | $313,400 | $148,000 | $165,400 |
| 2018 | $8,401 | $358,700 | $203,000 | $155,700 |
| 2017 | $7,566 | $279,100 | $138,000 | $141,100 |
| 2016 | $7,430 | $279,100 | $138,000 | $141,100 |
| 2015 | $7,318 | $279,100 | $138,000 | $141,100 |
| 2014 | $7,156 | $279,100 | $138,000 | $141,100 |
Source: Public Records
Map
Nearby Homes