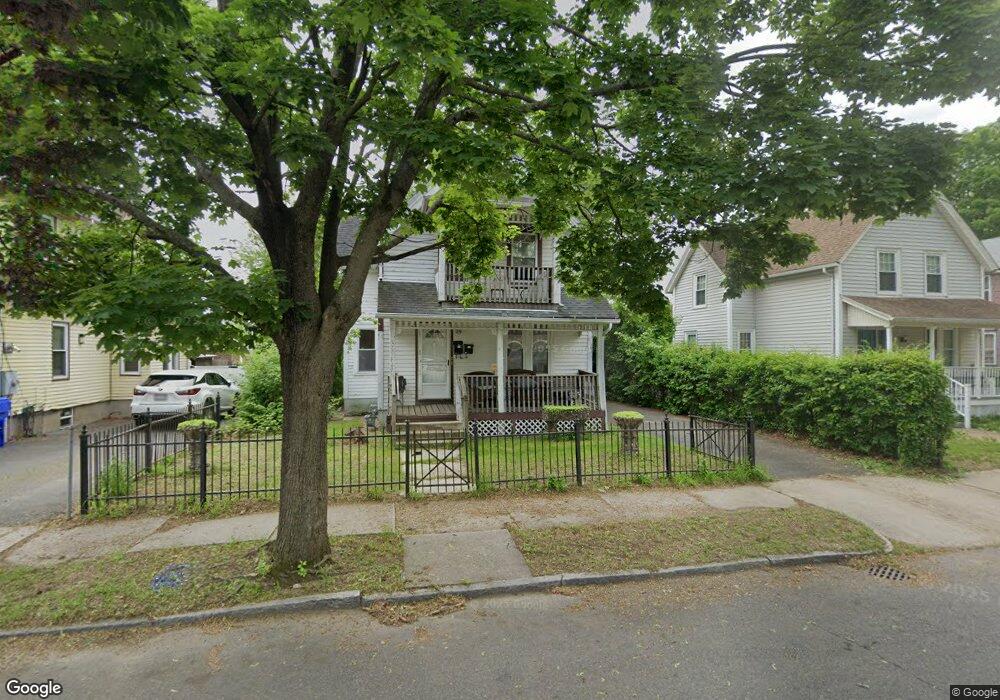
25 Granville St Springfield, MA 01109
Old Hill NeighborhoodEstimated Value: $221,000 - $278,494
4
Beds
2
Baths
1,560
Sq Ft
$157/Sq Ft
Est. Value
About This Home
This home is located at 25 Granville St, Springfield, MA 01109 and is currently estimated at $245,124, approximately $157 per square foot. 25 Granville St is a home located in Hampden County with nearby schools including Mary A. Dryden Veterans Memorial School, M Marcus Kiley Middle, and High School Of Commerce.
Ownership History
Date
Name
Owned For
Owner Type
Purchase Details
Closed on
Oct 11, 2006
Sold by
Campbell Angela B and Campbell John D
Bought by
Oneil Brendan T
Current Estimated Value
Home Financials for this Owner
Home Financials are based on the most recent Mortgage that was taken out on this home.
Original Mortgage
$92,000
Outstanding Balance
$54,929
Interest Rate
6.47%
Mortgage Type
Purchase Money Mortgage
Estimated Equity
$190,195
Purchase Details
Closed on
Apr 30, 2004
Sold by
Hatwood Dana J and Hatwood Derrick J
Bought by
Campbell Angela B and Campbell John D
Home Financials for this Owner
Home Financials are based on the most recent Mortgage that was taken out on this home.
Original Mortgage
$94,500
Interest Rate
5.36%
Mortgage Type
Purchase Money Mortgage
Purchase Details
Closed on
Oct 20, 2000
Sold by
Peeler William D Est
Bought by
Hatwood Derrick J and Hatwood Dana J
Create a Home Valuation Report for This Property
The Home Valuation Report is an in-depth analysis detailing your home's value as well as a comparison with similar homes in the area
Home Values in the Area
Average Home Value in this Area
Purchase History
| Date | Buyer | Sale Price | Title Company |
|---|---|---|---|
| Oneil Brendan T | $115,000 | -- | |
| Campbell Angela B | $105,000 | -- | |
| Hatwood Derrick J | $20,000 | -- |
Source: Public Records
Mortgage History
| Date | Status | Borrower | Loan Amount |
|---|---|---|---|
| Open | Oneil Brendan T | $92,000 | |
| Previous Owner | Campbell Angela B | $94,500 |
Source: Public Records
Tax History Compared to Growth
Tax History
| Year | Tax Paid | Tax Assessment Tax Assessment Total Assessment is a certain percentage of the fair market value that is determined by local assessors to be the total taxable value of land and additions on the property. | Land | Improvement |
|---|---|---|---|---|
| 2025 | $2,352 | $150,000 | $25,100 | $124,900 |
| 2024 | $1,946 | $121,200 | $23,500 | $97,700 |
| 2023 | $1,698 | $99,600 | $22,400 | $77,200 |
| 2022 | $1,445 | $76,800 | $20,300 | $56,500 |
| 2021 | $1,525 | $80,700 | $18,500 | $62,200 |
| 2020 | $1,547 | $79,200 | $18,500 | $60,700 |
| 2019 | $1,413 | $71,800 | $18,500 | $53,300 |
| 2018 | $1,413 | $71,800 | $18,500 | $53,300 |
| 2017 | $1,404 | $71,400 | $14,800 | $56,600 |
| 2016 | $1,256 | $63,900 | $14,800 | $49,100 |
| 2015 | $1,102 | $56,000 | $14,800 | $41,200 |
Source: Public Records
Map
Nearby Homes
- 108 Alden St
- 129 Eastern Ave
- 86 Alden St
- 162 Northampton Ave
- 183 Pendleton Ave
- 28-30 Nelson Ave
- 140 Northampton Ave
- 116 King St
- 290 Quincy St
- 368-370 Eastern Ave
- 56 Marshall St
- 21 Westford Cir
- 705-707 Union St
- 42 Queen St
- 179 Albemarle St
- 88 Dunmoreland St
- 68 Ashley St
- 0 NS (24) Alden St
- 124-126 Westford Cir
- 19 Westford Ave