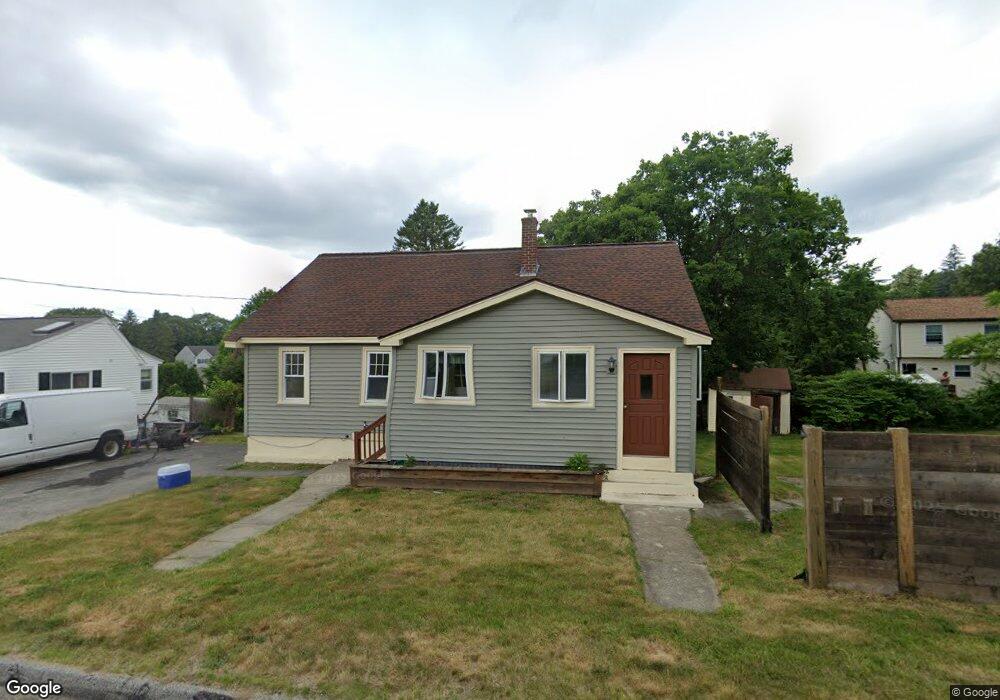
25 Greenbush Rd Worcester, MA 01604
Broadmeadow Brook NeighborhoodEstimated Value: $411,000 - $421,000
4
Beds
1
Bath
1,358
Sq Ft
$305/Sq Ft
Est. Value
About This Home
This home is located at 25 Greenbush Rd, Worcester, MA 01604 and is currently estimated at $414,697, approximately $305 per square foot. 25 Greenbush Rd is a home located in Worcester County with nearby schools including Jacob Hiatt Magnet School, Chandler Magnet, and Rice Square Elementary School.
Ownership History
Date
Name
Owned For
Owner Type
Purchase Details
Closed on
Oct 22, 2007
Sold by
Seymour Cheryl A
Bought by
Oconnor Steven J
Current Estimated Value
Purchase Details
Closed on
Jun 8, 2007
Sold by
Seymour Charlene
Bought by
Seymour Cheryl A
Purchase Details
Closed on
Aug 25, 2003
Sold by
94 Cranberry Ln Rt and Brown Jamie
Bought by
Seymour Charlene and Seymour Cheryl
Home Financials for this Owner
Home Financials are based on the most recent Mortgage that was taken out on this home.
Original Mortgage
$175,300
Interest Rate
5.52%
Mortgage Type
Purchase Money Mortgage
Purchase Details
Closed on
Aug 5, 2003
Sold by
94 Cranberry Lane Rt and Brown Jamie
Bought by
Mason Frances R
Home Financials for this Owner
Home Financials are based on the most recent Mortgage that was taken out on this home.
Original Mortgage
$175,300
Interest Rate
5.52%
Mortgage Type
Purchase Money Mortgage
Purchase Details
Closed on
Jul 8, 2003
Sold by
Carr Diane D and Carr Diane
Bought by
94 Cranberry St Rt and Brown Jamie
Home Financials for this Owner
Home Financials are based on the most recent Mortgage that was taken out on this home.
Original Mortgage
$175,300
Interest Rate
5.52%
Mortgage Type
Purchase Money Mortgage
Create a Home Valuation Report for This Property
The Home Valuation Report is an in-depth analysis detailing your home's value as well as a comparison with similar homes in the area
Home Values in the Area
Average Home Value in this Area
Purchase History
| Date | Buyer | Sale Price | Title Company |
|---|---|---|---|
| Oconnor Steven J | $220,000 | -- | |
| Seymour Cheryl A | -- | -- | |
| Seymour Charlene | $184,500 | -- | |
| 94 Cranberry Lane Rt | -- | -- | |
| Mason Frances R | -- | -- | |
| 94 Cranberry St Rt | -- | -- |
Source: Public Records
Mortgage History
| Date | Status | Borrower | Loan Amount |
|---|---|---|---|
| Previous Owner | Seymour Charlene | $175,300 |
Source: Public Records
Tax History
| Year | Tax Paid | Tax Assessment Tax Assessment Total Assessment is a certain percentage of the fair market value that is determined by local assessors to be the total taxable value of land and additions on the property. | Land | Improvement |
|---|---|---|---|---|
| 2025 | $4,599 | $348,700 | $118,700 | $230,000 |
| 2024 | $4,517 | $328,500 | $118,700 | $209,800 |
| 2023 | $4,319 | $301,200 | $103,200 | $198,000 |
| 2022 | $3,942 | $259,200 | $82,600 | $176,600 |
| 2021 | $3,733 | $229,300 | $66,100 | $163,200 |
| 2020 | $3,645 | $214,400 | $66,100 | $148,300 |
| 2019 | $3,463 | $192,400 | $59,500 | $132,900 |
| 2018 | $3,478 | $183,900 | $59,500 | $124,400 |
| 2017 | $3,335 | $173,500 | $59,500 | $114,000 |
| 2016 | $3,250 | $157,700 | $43,700 | $114,000 |
| 2015 | $3,165 | $157,700 | $43,700 | $114,000 |
| 2014 | $3,081 | $157,700 | $43,700 | $114,000 |
Source: Public Records
Map
Nearby Homes
- 25 Stoneham Rd
- 259 Massasoit Rd
- 266 Massasoit Rd
- 256 Massasoit Rd
- 16 Vincent Cir
- 330 Sunderland Rd Unit 80
- 330 Sunderland Rd Unit 69
- 3 Julien Ave
- 270 Sunderland Rd Unit 2
- 340 Sunderland Rd Unit 28
- 239 Dana Ave
- 143 Commonwealth Ave
- 83 Massasoit Rd
- 1195 Grafton St Unit 19
- 1195 Grafton St Unit 39
- 1205 Grafton St Unit 31
- 1260 Grafton St
- 7 Clarissa St
- 128 Derby St
- 1257 Grafton St
- 28 Stoneham Rd
- 21 Greenbush Rd
- 30 Stoneham Rd
- 26 Greenbush Rd
- 19 Greenbush Rd
- 6 Somerville Rd
- 18 Stoneham Rd
- 22 Greenbush Rd
- 27 Stoneham Rd
- 15 Greenbush Rd
- 1 Somerville Rd
- 1 Somerville Rd Unit 1A
- 29 Stoneham Rd
- 24 Somerville Rd
- 24 Somerville Rd Unit 1
- 16 Greenbush Rd
- 99 Lawton St
- 16 Stoneham Rd
- 29 Lawton St
- 14 Stoneham Rd
Your Personal Tour Guide
Ask me questions while you tour the home.