Estimated Value: $288,908 - $384,000
3
Beds
2
Baths
1,824
Sq Ft
$183/Sq Ft
Est. Value
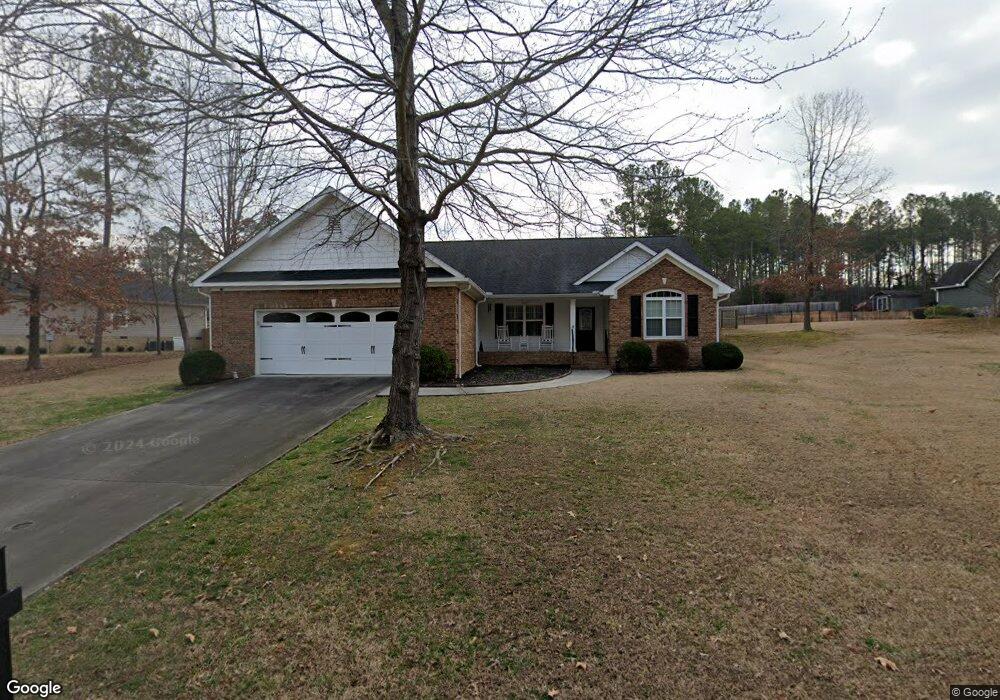
About This Home
This home is located at 25 Hadrian Ridge Dr SW Unit 41, Rome, GA 30165 and is currently estimated at $333,977, approximately $183 per square foot. 25 Hadrian Ridge Dr SW Unit 41 is a home located in Floyd County with nearby schools including Coosa Middle School and Coosa High School.
Ownership History
Date
Name
Owned For
Owner Type
Purchase Details
Closed on
Dec 27, 2013
Sold by
Thomas Claudia D
Bought by
Rogers Jimmy E and Rogers Sharon E
Current Estimated Value
Home Financials for this Owner
Home Financials are based on the most recent Mortgage that was taken out on this home.
Original Mortgage
$130,000
Outstanding Balance
$34,549
Interest Rate
3.23%
Mortgage Type
New Conventional
Estimated Equity
$299,428
Purchase Details
Closed on
Sep 29, 2006
Sold by
Not Provided
Bought by
Thomas Claudia D
Home Financials for this Owner
Home Financials are based on the most recent Mortgage that was taken out on this home.
Original Mortgage
$87,000
Interest Rate
6.36%
Mortgage Type
New Conventional
Purchase Details
Closed on
Nov 23, 2005
Sold by
Highlands Subdivision Llc
Bought by
Smith Robert J and Brooks William Steven
Purchase Details
Closed on
Aug 20, 2004
Bought by
Highlands Subdivision Llc
Create a Home Valuation Report for This Property
The Home Valuation Report is an in-depth analysis detailing your home's value as well as a comparison with similar homes in the area
Home Values in the Area
Average Home Value in this Area
Purchase History
| Date | Buyer | Sale Price | Title Company |
|---|---|---|---|
| Rogers Jimmy E | $165,000 | -- | |
| Thomas Claudia D | $174,000 | -- | |
| Smith Robert J | $182,000 | -- | |
| Highlands Subdivision Llc | -- | -- |
Source: Public Records
Mortgage History
| Date | Status | Borrower | Loan Amount |
|---|---|---|---|
| Open | Rogers Jimmy E | $130,000 | |
| Previous Owner | Thomas Claudia D | $87,000 |
Source: Public Records
Tax History Compared to Growth
Tax History
| Year | Tax Paid | Tax Assessment Tax Assessment Total Assessment is a certain percentage of the fair market value that is determined by local assessors to be the total taxable value of land and additions on the property. | Land | Improvement |
|---|---|---|---|---|
| 2024 | $2,490 | $109,892 | $11,552 | $98,340 |
| 2023 | $2,504 | $107,187 | $11,552 | $95,635 |
| 2022 | $2,283 | $91,909 | $11,000 | $80,909 |
| 2021 | $2,068 | $78,064 | $11,000 | $67,064 |
| 2020 | $2,031 | $75,151 | $11,000 | $64,151 |
| 2019 | $1,953 | $72,155 | $11,000 | $61,155 |
| 2018 | $1,832 | $65,346 | $11,000 | $54,346 |
| 2017 | $1,782 | $62,422 | $11,000 | $51,422 |
| 2016 | $1,782 | $61,560 | $11,000 | $50,560 |
| 2015 | $1,184 | $62,080 | $11,000 | $51,080 |
| 2014 | $1,184 | $62,080 | $11,000 | $51,080 |
Source: Public Records
Map
Nearby Homes
- 63 Highlander Trail SW
- 14 Bryan Springs Rd SW
- 48 Highlander Trail SW
- 3 SW Highlander Trail SW
- 0 Barker Rd SW Unit 10651788
- 0 Barker Rd SW Unit LotWP001
- 0 Ausburn Rd SW Unit 10611100
- 876 Barker Rd SW
- 973 Barker Rd SW
- 26 Red Fox Dr SW
- 5 Red Fox Dr SW
- 775 Mays Bridge Rd SW
- 3428 Horseleg Creek Rd SW
- 458 Kraftsman Rd SW
- 89 Barker Rd SW
- 3241 Horseleg Creek Rd SW
- 8 Kayla Dr NW
- 83 Manning Lake Rd SW
- 22 Wet Oak Dr NW
- 0 Mt Alto Rd Sw Lot Unit WP001
- 25 Hadrian Ridge Dr SW
- 27 Hadrian Ridge Dr SW
- 23 Hadrian Ridge Dr SW Unit 40
- 23 Hadrian Ridge Dr SW
- 51 Hadrian Ridge Dr SW
- 4 Susanne Ct SW
- 28 Hadrian Ridge Dr SW
- 74 Highlander Trail SW
- 32 Hadrian Ridge Dr SW
- 6 Susanne Ct SW
- 1 Ellen Ct SW
- 1 Susanne Ct SW
- 24 Hadrian Ridge Dr SW
- 8 Susanne Ct SW
- 31 Hadrian Ridge Dr SW
- 72 Highlander Trail SW
- 3 Susanne Ct SW
- 69 Highlander Trail SW
- 35 Hidden Ridge Dr SW
- 36 Hadrian Ridge Dr SW