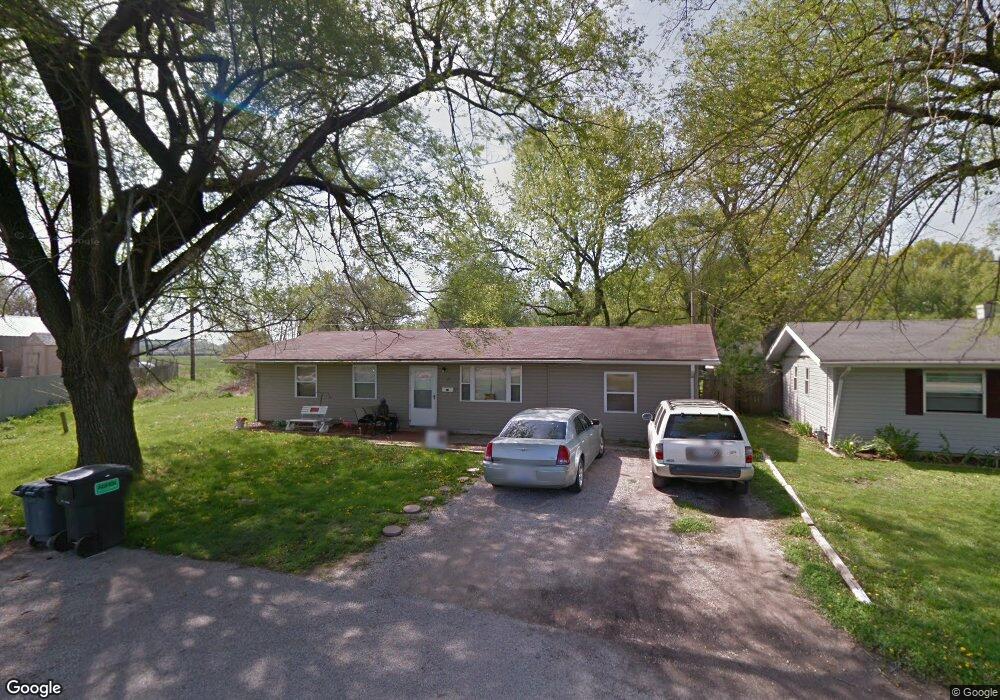
25 Hanover Ln East Saint Louis, IL 62206
Estimated Value: $68,000 - $92,000
--
Bed
--
Bath
1,225
Sq Ft
$68/Sq Ft
Est. Value
About This Home
This home is located at 25 Hanover Ln, East Saint Louis, IL 62206 and is currently estimated at $82,742, approximately $67 per square foot. 25 Hanover Ln is a home located in St. Clair County.
Ownership History
Date
Name
Owned For
Owner Type
Purchase Details
Closed on
Feb 26, 2008
Sold by
Lochmann Scott and Becherer Gregory
Bought by
Lochmann Scott and Lochmann Kim
Current Estimated Value
Home Financials for this Owner
Home Financials are based on the most recent Mortgage that was taken out on this home.
Original Mortgage
$245,000
Interest Rate
6.7%
Mortgage Type
Purchase Money Mortgage
Purchase Details
Closed on
Dec 24, 2003
Sold by
Deutsche Bank National Trust Co
Bought by
Lochmann Scott and Becherer Greg
Purchase Details
Closed on
Oct 27, 2003
Sold by
Fl Yance Price
Bought by
Deutsche Bank National Trust Co
Create a Home Valuation Report for This Property
The Home Valuation Report is an in-depth analysis detailing your home's value as well as a comparison with similar homes in the area
Home Values in the Area
Average Home Value in this Area
Purchase History
| Date | Buyer | Sale Price | Title Company |
|---|---|---|---|
| Lochmann Scott | -- | Siretc | |
| Lochmann Scott | $24,000 | First American Title Insuran | |
| Deutsche Bank National Trust Co | -- | -- |
Source: Public Records
Mortgage History
| Date | Status | Borrower | Loan Amount |
|---|---|---|---|
| Closed | Lochmann Scott | $245,000 |
Source: Public Records
Tax History Compared to Growth
Tax History
| Year | Tax Paid | Tax Assessment Tax Assessment Total Assessment is a certain percentage of the fair market value that is determined by local assessors to be the total taxable value of land and additions on the property. | Land | Improvement |
|---|---|---|---|---|
| 2024 | $2,142 | $11,194 | $1,857 | $9,337 |
| 2023 | $1,933 | $10,117 | $1,678 | $8,439 |
| 2022 | $1,738 | $8,867 | $1,471 | $7,396 |
| 2021 | $1,842 | $8,402 | $1,394 | $7,008 |
| 2020 | $1,990 | $8,377 | $1,460 | $6,917 |
| 2019 | $2,027 | $8,377 | $1,460 | $6,917 |
| 2018 | $2,016 | $8,499 | $1,481 | $7,018 |
| 2017 | $2,005 | $8,294 | $1,445 | $6,849 |
| 2016 | $2,097 | $8,167 | $1,439 | $6,728 |
| 2014 | $1,737 | $8,078 | $1,423 | $6,655 |
| 2013 | $2,573 | $7,577 | $1,335 | $6,242 |
Source: Public Records
Map
Nearby Homes