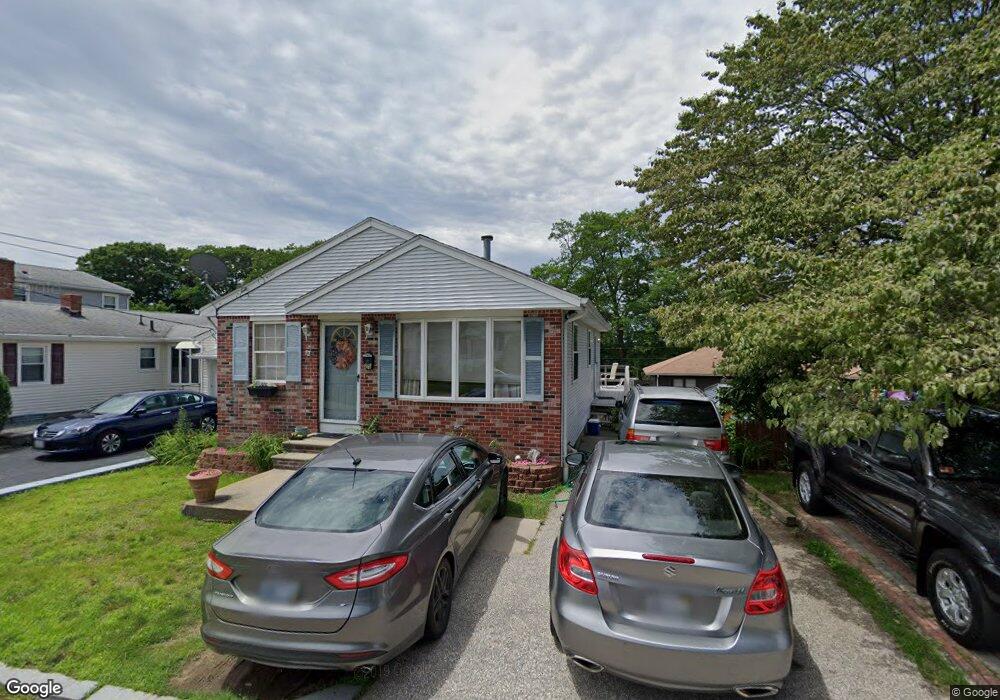
25 Harmony Dr Providence, RI 02909
Manton NeighborhoodEstimated Value: $362,000 - $387,000
2
Beds
3
Baths
960
Sq Ft
$388/Sq Ft
Est. Value
About This Home
This home is located at 25 Harmony Dr, Providence, RI 02909 and is currently estimated at $372,698, approximately $388 per square foot. 25 Harmony Dr is a home located in Providence County with nearby schools including Blessed Sacrament School and Mount Pleasant Academy.
Ownership History
Date
Name
Owned For
Owner Type
Purchase Details
Closed on
Nov 24, 2010
Sold by
Cesario Bryan and Dinobile-Cesario Donna
Bought by
Dinoble Donna
Current Estimated Value
Home Financials for this Owner
Home Financials are based on the most recent Mortgage that was taken out on this home.
Original Mortgage
$134,714
Outstanding Balance
$91,031
Interest Rate
4.75%
Mortgage Type
FHA
Estimated Equity
$281,667
Purchase Details
Closed on
Dec 27, 1990
Sold by
Dinobile Steven A
Bought by
Cesario Bryan K
Create a Home Valuation Report for This Property
The Home Valuation Report is an in-depth analysis detailing your home's value as well as a comparison with similar homes in the area
Home Values in the Area
Average Home Value in this Area
Purchase History
| Date | Buyer | Sale Price | Title Company |
|---|---|---|---|
| Dinoble Donna | -- | -- | |
| Cesario Bryan K | $85,000 | -- |
Source: Public Records
Mortgage History
| Date | Status | Borrower | Loan Amount |
|---|---|---|---|
| Open | Cesario Bryan K | $134,714 | |
| Previous Owner | Cesario Bryan K | $25,000 | |
| Previous Owner | Cesario Bryan K | $135,000 | |
| Previous Owner | Cesario Bryan K | $115,788 |
Source: Public Records
Tax History
| Year | Tax Paid | Tax Assessment Tax Assessment Total Assessment is a certain percentage of the fair market value that is determined by local assessors to be the total taxable value of land and additions on the property. | Land | Improvement |
|---|---|---|---|---|
| 2025 | $3,115 | $370,800 | $126,700 | $244,100 |
| 2024 | $5,270 | $287,200 | $73,300 | $213,900 |
| 2023 | $5,270 | $287,200 | $73,300 | $213,900 |
| 2022 | $5,112 | $287,200 | $73,300 | $213,900 |
| 2021 | $4,352 | $177,200 | $51,300 | $125,900 |
| 2020 | $4,352 | $177,200 | $51,300 | $125,900 |
| 2019 | $4,352 | $177,200 | $51,300 | $125,900 |
| 2018 | $3,669 | $114,800 | $32,900 | $81,900 |
| 2017 | $3,669 | $114,800 | $32,900 | $81,900 |
| 2016 | $3,669 | $114,800 | $32,900 | $81,900 |
| 2015 | $3,386 | $102,300 | $30,200 | $72,100 |
| 2014 | $3,453 | $102,300 | $30,200 | $72,100 |
| 2013 | $3,453 | $102,300 | $30,200 | $72,100 |
Source: Public Records
Map
Nearby Homes
Your Personal Tour Guide
Ask me questions while you tour the home.