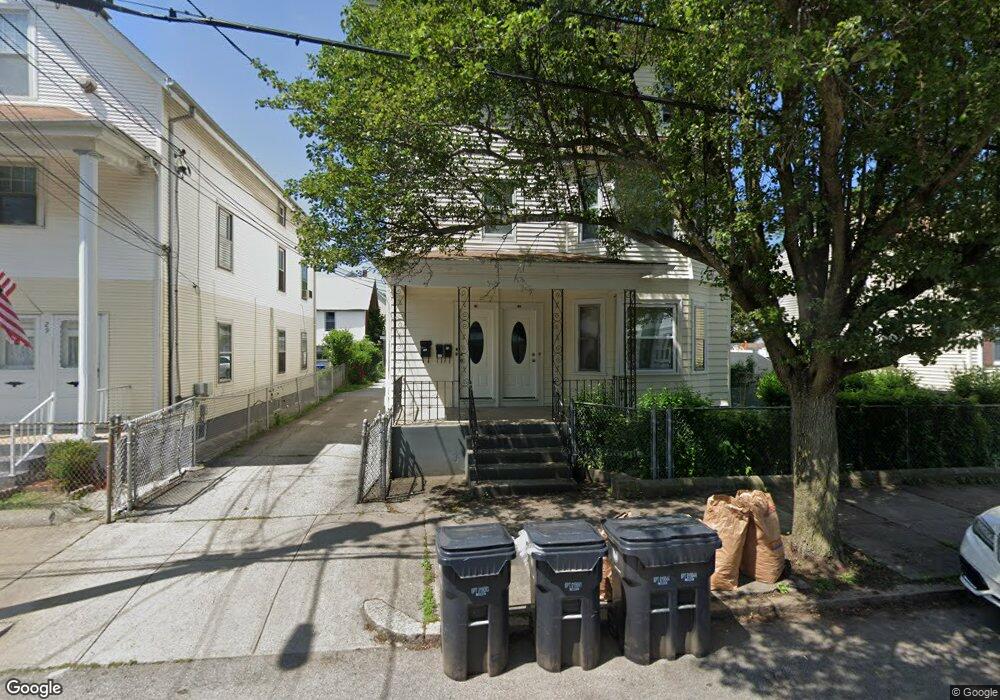
25 Heaton St Pawtucket, RI 02860
Woodlawn NeighborhoodEstimated Value: $551,779 - $679,000
6
Beds
3
Baths
3,384
Sq Ft
$186/Sq Ft
Est. Value
About This Home
This home is located at 25 Heaton St, Pawtucket, RI 02860 and is currently estimated at $629,445, approximately $186 per square foot. 25 Heaton St is a home located in Providence County with nearby schools including International Charter School, Blackstone Academy Charter School, and Jewish Community Day School Of Rhode Island.
Ownership History
Date
Name
Owned For
Owner Type
Purchase Details
Closed on
Jun 30, 1994
Sold by
Lopera Luis H and Lopera Beatriz O
Bought by
Centeio Manuel F and Centeio Eurico F
Current Estimated Value
Home Financials for this Owner
Home Financials are based on the most recent Mortgage that was taken out on this home.
Original Mortgage
$130,150
Interest Rate
8.55%
Create a Home Valuation Report for This Property
The Home Valuation Report is an in-depth analysis detailing your home's value as well as a comparison with similar homes in the area
Home Values in the Area
Average Home Value in this Area
Purchase History
| Date | Buyer | Sale Price | Title Company |
|---|---|---|---|
| Centeio Manuel F | $137,000 | -- |
Source: Public Records
Mortgage History
| Date | Status | Borrower | Loan Amount |
|---|---|---|---|
| Open | Centeio Manuel F | $130,000 | |
| Closed | Centeio Manuel F | $130,150 |
Source: Public Records
Tax History
| Year | Tax Paid | Tax Assessment Tax Assessment Total Assessment is a certain percentage of the fair market value that is determined by local assessors to be the total taxable value of land and additions on the property. | Land | Improvement |
|---|---|---|---|---|
| 2025 | $6,792 | $516,500 | $121,400 | $395,100 |
| 2024 | $6,374 | $516,500 | $121,400 | $395,100 |
| 2023 | $5,592 | $330,100 | $54,700 | $275,400 |
| 2022 | $5,473 | $330,100 | $54,700 | $275,400 |
| 2021 | $5,473 | $330,100 | $54,700 | $275,400 |
| 2020 | $4,602 | $220,300 | $55,300 | $165,000 |
| 2019 | $4,602 | $220,300 | $55,300 | $165,000 |
| 2018 | $4,435 | $220,300 | $55,300 | $165,000 |
| 2017 | $4,219 | $185,700 | $42,500 | $143,200 |
| 2016 | $4,065 | $185,700 | $42,500 | $143,200 |
| 2015 | $4,065 | $185,700 | $42,500 | $143,200 |
| 2014 | $3,537 | $153,400 | $54,700 | $98,700 |
Source: Public Records
Map
Nearby Homes
- 41 Campbell Terrace
- 32 Carver St
- 11 Sherman St
- 187 Sisson St
- 126 Dunnell Ave
- 18 Dunnell Ave
- 80 Hillside Ave
- 122 Lowden St
- 136 Hillside Ave
- 54 Jefferson Ave
- 50 Jefferson Ave
- 6 Alfred Stone Rd
- 5 Lowden St
- 51 Wilcox Ave
- 17 Grotto Ave Unit 1
- 163 West Ave
- 35 Hurley Ave
- 107 Mulberry St
- 167 George St
- 76 Slater St
Your Personal Tour Guide
Ask me questions while you tour the home.