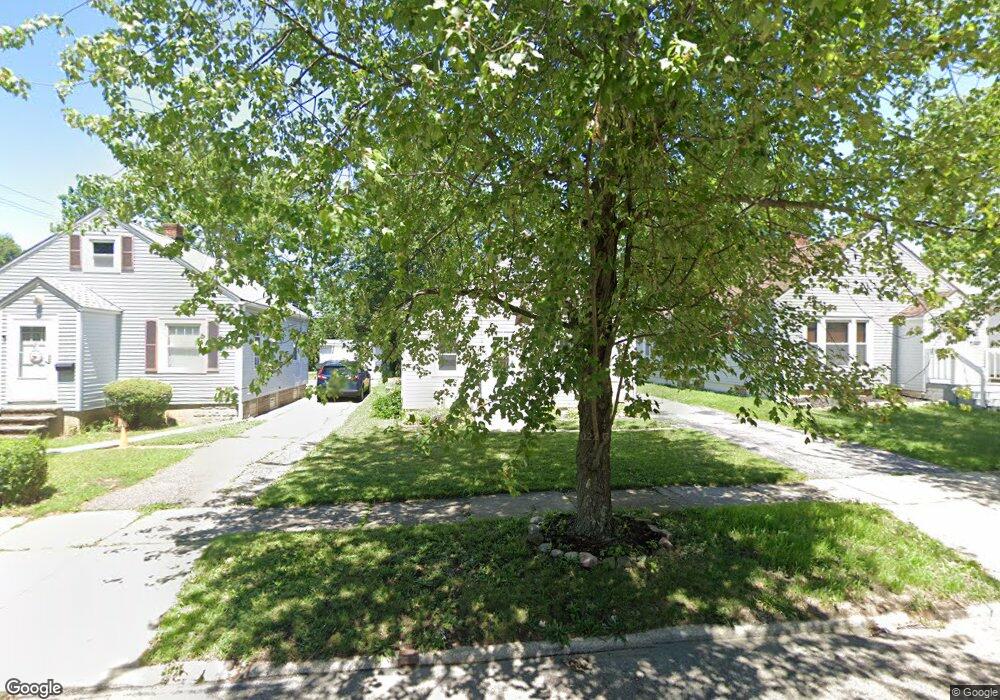
25 Henry St Bedford, OH 44146
Estimated Value: $108,000 - $142,000
3
Beds
1
Bath
1,152
Sq Ft
$108/Sq Ft
Est. Value
About This Home
This home is located at 25 Henry St, Bedford, OH 44146 and is currently estimated at $124,141, approximately $107 per square foot. 25 Henry St is a home located in Cuyahoga County with nearby schools including Heskett Middle School, Bedford High School, and Ohio College Preparatory School.
Ownership History
Date
Name
Owned For
Owner Type
Purchase Details
Closed on
May 24, 2019
Sold by
Jones Joseph L
Bought by
Wolf Cecilia Lee
Current Estimated Value
Purchase Details
Closed on
Sep 16, 2009
Sold by
Secretary Of Housing & Urban Development
Bought by
Jones Cecilia L and Jones Joseph L
Purchase Details
Closed on
Aug 25, 2006
Sold by
Redic Nasheem S
Bought by
Hud
Purchase Details
Closed on
Jul 17, 2002
Sold by
Krause Phyllis A
Bought by
Redic Nasheem S
Home Financials for this Owner
Home Financials are based on the most recent Mortgage that was taken out on this home.
Original Mortgage
$75,711
Interest Rate
6.7%
Mortgage Type
FHA
Purchase Details
Closed on
Aug 19, 1992
Sold by
Lang Charles E
Bought by
Lang Charles
Purchase Details
Closed on
Aug 30, 1985
Sold by
Skladoni Betty M
Bought by
Lang Charles E
Purchase Details
Closed on
Feb 22, 1984
Sold by
Skladoni George E
Bought by
Skladoni Betty M
Purchase Details
Closed on
Jan 1, 1975
Bought by
Skladoni George E
Create a Home Valuation Report for This Property
The Home Valuation Report is an in-depth analysis detailing your home's value as well as a comparison with similar homes in the area
Home Values in the Area
Average Home Value in this Area
Purchase History
| Date | Buyer | Sale Price | Title Company |
|---|---|---|---|
| Wolf Cecilia Lee | -- | None Available | |
| Jones Cecilia L | $12,051 | Lakeside Title & Escrow Agen | |
| Hud | $53,334 | Attorney | |
| Redic Nasheem S | $76,900 | Executive Title | |
| Lang Charles | -- | -- | |
| Lang Charles E | -- | -- | |
| Skladoni Betty M | -- | -- | |
| Skladoni George E | -- | -- |
Source: Public Records
Mortgage History
| Date | Status | Borrower | Loan Amount |
|---|---|---|---|
| Previous Owner | Redic Nasheem S | $75,711 |
Source: Public Records
Tax History
| Year | Tax Paid | Tax Assessment Tax Assessment Total Assessment is a certain percentage of the fair market value that is determined by local assessors to be the total taxable value of land and additions on the property. | Land | Improvement |
|---|---|---|---|---|
| 2025 | $2,884 | $36,330 | $7,595 | $28,735 |
| 2024 | $2,848 | $36,330 | $7,595 | $28,735 |
| 2023 | $2,638 | $28,950 | $6,510 | $22,440 |
| 2022 | $2,338 | $28,950 | $6,510 | $22,440 |
| 2021 | $2,263 | $28,950 | $6,510 | $22,440 |
| 2020 | $2,129 | $24,330 | $5,460 | $18,870 |
| 2019 | $2,075 | $69,500 | $15,600 | $53,900 |
| 2018 | $2,056 | $24,330 | $5,460 | $18,870 |
| 2017 | $2,069 | $23,070 | $5,010 | $18,060 |
| 2016 | $2,052 | $23,070 | $5,010 | $18,060 |
| 2015 | $2,035 | $23,070 | $5,010 | $18,060 |
| 2014 | $2,035 | $25,070 | $5,430 | $19,640 |
Source: Public Records
Map
Nearby Homes
Your Personal Tour Guide
Ask me questions while you tour the home.