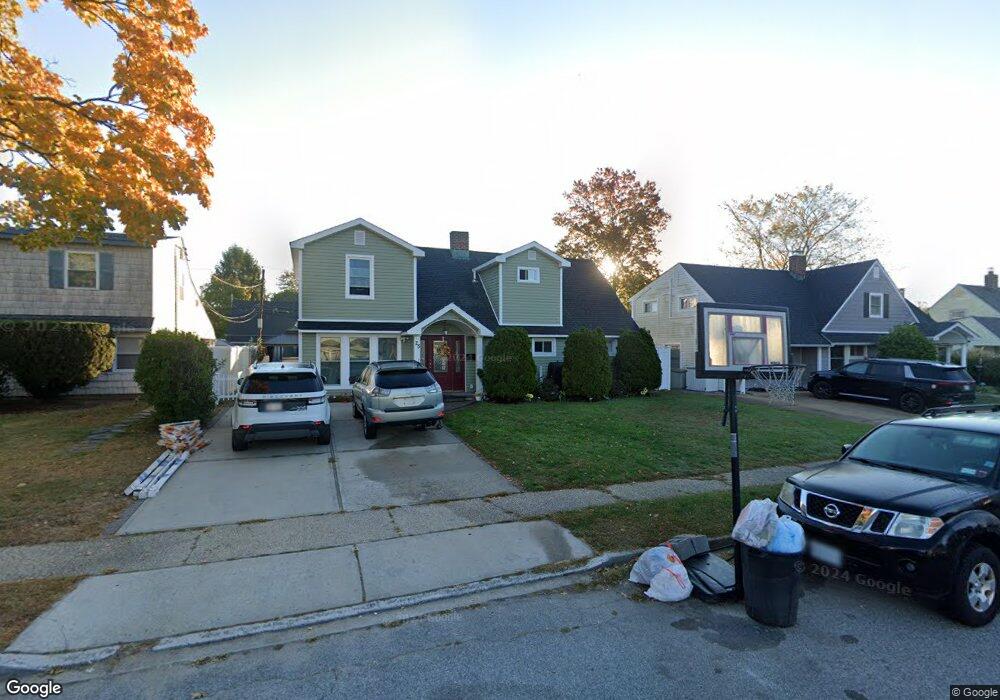
25 High Ln Levittown, NY 11756
Estimated Value: $547,000 - $669,895
4
Beds
1
Bath
1,114
Sq Ft
$546/Sq Ft
Est. Value
About This Home
This home is located at 25 High Ln, Levittown, NY 11756 and is currently estimated at $608,448, approximately $546 per square foot. 25 High Ln is a home located in Nassau County with nearby schools including Abbey Lane Elementary School, Jonas E. Salk Middle School, and Gen. Douglas MacArthur Senior High School.
Ownership History
Date
Name
Owned For
Owner Type
Purchase Details
Closed on
Jul 29, 2015
Sold by
Galvin Joan P and Galvin Thomas J
Bought by
Rivera Juan and Arancibia Patricia
Current Estimated Value
Home Financials for this Owner
Home Financials are based on the most recent Mortgage that was taken out on this home.
Original Mortgage
$245,489
Outstanding Balance
$193,403
Interest Rate
4.08%
Mortgage Type
FHA
Estimated Equity
$415,045
Purchase Details
Closed on
Dec 13, 1996
Sold by
Tierney John
Bought by
Galvin Thomas and Galvin Joan
Create a Home Valuation Report for This Property
The Home Valuation Report is an in-depth analysis detailing your home's value as well as a comparison with similar homes in the area
Home Values in the Area
Average Home Value in this Area
Purchase History
| Date | Buyer | Sale Price | Title Company |
|---|---|---|---|
| Rivera Juan | $255,000 | None Available | |
| Galvin Thomas | $129,780 | -- |
Source: Public Records
Mortgage History
| Date | Status | Borrower | Loan Amount |
|---|---|---|---|
| Open | Rivera Juan | $245,489 |
Source: Public Records
Tax History
| Year | Tax Paid | Tax Assessment Tax Assessment Total Assessment is a certain percentage of the fair market value that is determined by local assessors to be the total taxable value of land and additions on the property. | Land | Improvement |
|---|---|---|---|---|
| 2025 | $12,524 | $375 | $213 | $162 |
| 2024 | $3,408 | $375 | $213 | $162 |
Source: Public Records
Map
Nearby Homes