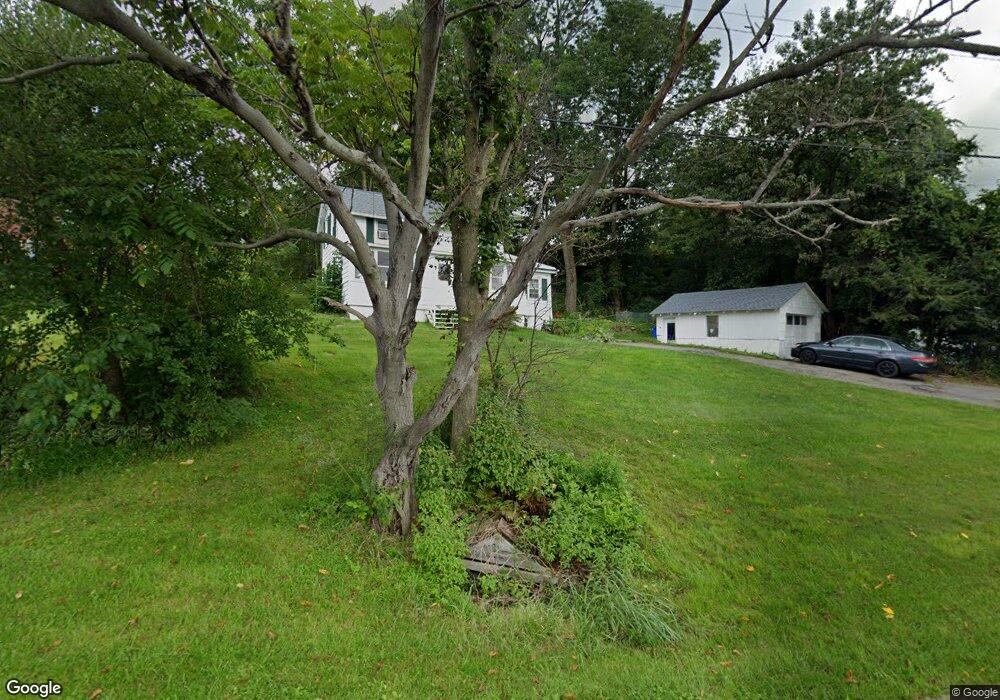
25 Highland Ave Netcong, NJ 07857
Estimated Value: $398,000 - $460,000
--
Bed
--
Bath
1,560
Sq Ft
$274/Sq Ft
Est. Value
About This Home
This home is located at 25 Highland Ave, Netcong, NJ 07857 and is currently estimated at $426,871, approximately $273 per square foot. 25 Highland Ave is a home located in Morris County with nearby schools including Netcong Elementary School, Lenape Val Regional High School, and Elite Preparatory Academy.
Ownership History
Date
Name
Owned For
Owner Type
Purchase Details
Closed on
Sep 16, 2002
Sold by
Arahill Patricia
Bought by
Hughson Brian and Hughson Sharon
Current Estimated Value
Home Financials for this Owner
Home Financials are based on the most recent Mortgage that was taken out on this home.
Original Mortgage
$140,000
Outstanding Balance
$58,611
Interest Rate
6.27%
Estimated Equity
$368,260
Purchase Details
Closed on
Mar 14, 1998
Sold by
Newton Robert and Newton Shirley
Bought by
Arahill Patricia
Create a Home Valuation Report for This Property
The Home Valuation Report is an in-depth analysis detailing your home's value as well as a comparison with similar homes in the area
Home Values in the Area
Average Home Value in this Area
Purchase History
| Date | Buyer | Sale Price | Title Company |
|---|---|---|---|
| Hughson Brian | $215,000 | -- | |
| Arahill Patricia | $100,000 | -- |
Source: Public Records
Mortgage History
| Date | Status | Borrower | Loan Amount |
|---|---|---|---|
| Open | Hughson Brian | $140,000 |
Source: Public Records
Tax History Compared to Growth
Tax History
| Year | Tax Paid | Tax Assessment Tax Assessment Total Assessment is a certain percentage of the fair market value that is determined by local assessors to be the total taxable value of land and additions on the property. | Land | Improvement |
|---|---|---|---|---|
| 2025 | $8,355 | $244,500 | $106,500 | $138,000 |
| 2024 | $8,428 | $244,500 | $106,500 | $138,000 |
| 2023 | $8,428 | $244,500 | $106,500 | $138,000 |
| 2022 | $7,636 | $244,500 | $106,500 | $138,000 |
| 2021 | $7,636 | $244,500 | $106,500 | $138,000 |
| 2020 | $9,117 | $296,400 | $152,000 | $144,400 |
| 2019 | $8,679 | $296,400 | $152,000 | $144,400 |
| 2018 | $8,160 | $296,400 | $152,000 | $144,400 |
| 2017 | $7,840 | $296,400 | $152,000 | $144,400 |
| 2016 | $7,626 | $296,400 | $152,000 | $144,400 |
| 2015 | $7,348 | $296,400 | $152,000 | $144,400 |
| 2014 | $7,028 | $296,400 | $152,000 | $144,400 |
Source: Public Records
Map
Nearby Homes