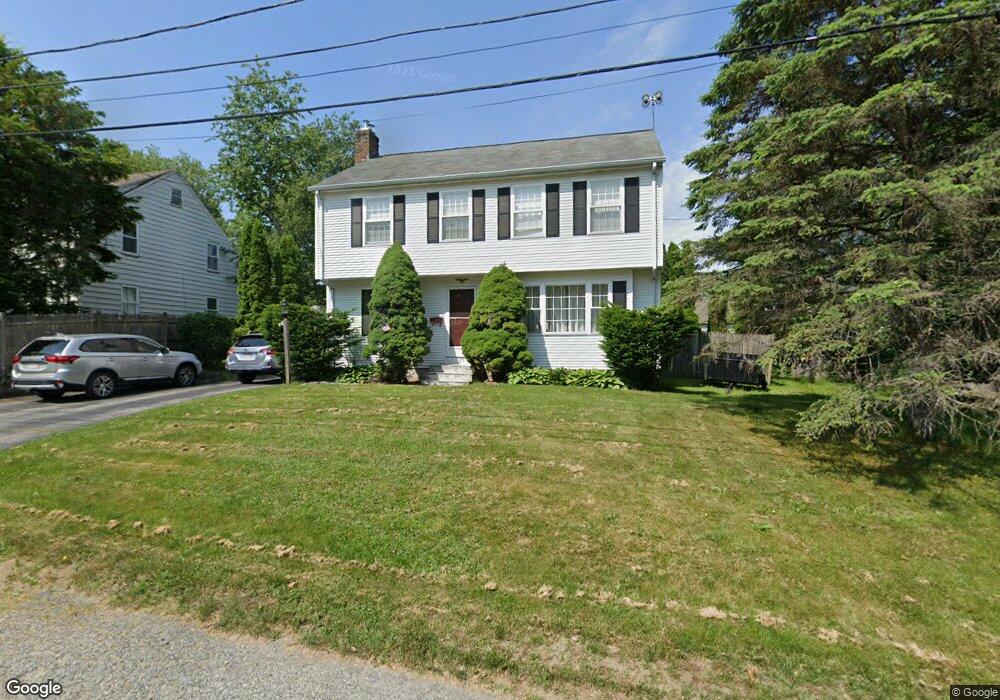
25 Hulbert Rd Worcester, MA 01603
Hadwen Park NeighborhoodEstimated Value: $403,000 - $485,000
3
Beds
2
Baths
1,600
Sq Ft
$280/Sq Ft
Est. Value
About This Home
This home is located at 25 Hulbert Rd, Worcester, MA 01603 and is currently estimated at $447,671, approximately $279 per square foot. 25 Hulbert Rd is a home located in Worcester County with nearby schools including Jacob Hiatt Magnet School, Chandler Magnet, and Heard Street Discovery Academy.
Ownership History
Date
Name
Owned For
Owner Type
Purchase Details
Closed on
Jan 25, 2024
Sold by
Esposito Frances M and Pilski Richard A
Bought by
Pilski Ft and Pilski
Current Estimated Value
Purchase Details
Closed on
May 29, 1987
Sold by
Village Rt
Bought by
Pilski Richard A
Home Financials for this Owner
Home Financials are based on the most recent Mortgage that was taken out on this home.
Original Mortgage
$50,000
Interest Rate
10.25%
Mortgage Type
Purchase Money Mortgage
Create a Home Valuation Report for This Property
The Home Valuation Report is an in-depth analysis detailing your home's value as well as a comparison with similar homes in the area
Home Values in the Area
Average Home Value in this Area
Purchase History
| Date | Buyer | Sale Price | Title Company |
|---|---|---|---|
| Pilski Ft | -- | None Available | |
| Pilski Richard A | $133,000 | -- |
Source: Public Records
Mortgage History
| Date | Status | Borrower | Loan Amount |
|---|---|---|---|
| Previous Owner | Pilski Richard A | $30,000 | |
| Previous Owner | Pilski Richard A | $50,000 |
Source: Public Records
Tax History
| Year | Tax Paid | Tax Assessment Tax Assessment Total Assessment is a certain percentage of the fair market value that is determined by local assessors to be the total taxable value of land and additions on the property. | Land | Improvement |
|---|---|---|---|---|
| 2025 | $5,189 | $393,400 | $97,600 | $295,800 |
| 2024 | $5,070 | $368,700 | $97,600 | $271,100 |
| 2023 | $4,883 | $340,500 | $84,800 | $255,700 |
| 2022 | $4,566 | $300,200 | $67,900 | $232,300 |
| 2021 | $4,412 | $271,000 | $54,300 | $216,700 |
| 2020 | $4,260 | $250,600 | $53,900 | $196,700 |
| 2019 | $4,077 | $226,500 | $47,000 | $179,500 |
| 2018 | $4,034 | $213,300 | $47,000 | $166,300 |
| 2017 | $3,871 | $201,400 | $47,000 | $154,400 |
| 2016 | $3,858 | $187,200 | $33,200 | $154,000 |
| 2015 | $3,757 | $187,200 | $33,200 | $154,000 |
| 2014 | $3,658 | $187,200 | $33,200 | $154,000 |
Source: Public Records
Map
Nearby Homes
- 11 Hulbert Rd Unit 13
- 35 Genessee St Unit E
- 103 Henshaw St
- 55 Grandview Ave
- 99 Clover St
- 26 Sylvan St
- 32 Goddard Memorial Dr
- 27 Havana Rd
- 13 Merchant St
- 315 Stafford St
- 2 Montague St
- 56 Goddard Memorial Dr
- 1511 Main St Unit C405
- 27 Montague St
- 25 Wyola Dr
- 23 Lakewood St
- 128 Wildwood Ave
- 37 Gates Rd
- 31 B Gates Rd Unit 22R
- 177 Boyce St
Your Personal Tour Guide
Ask me questions while you tour the home.