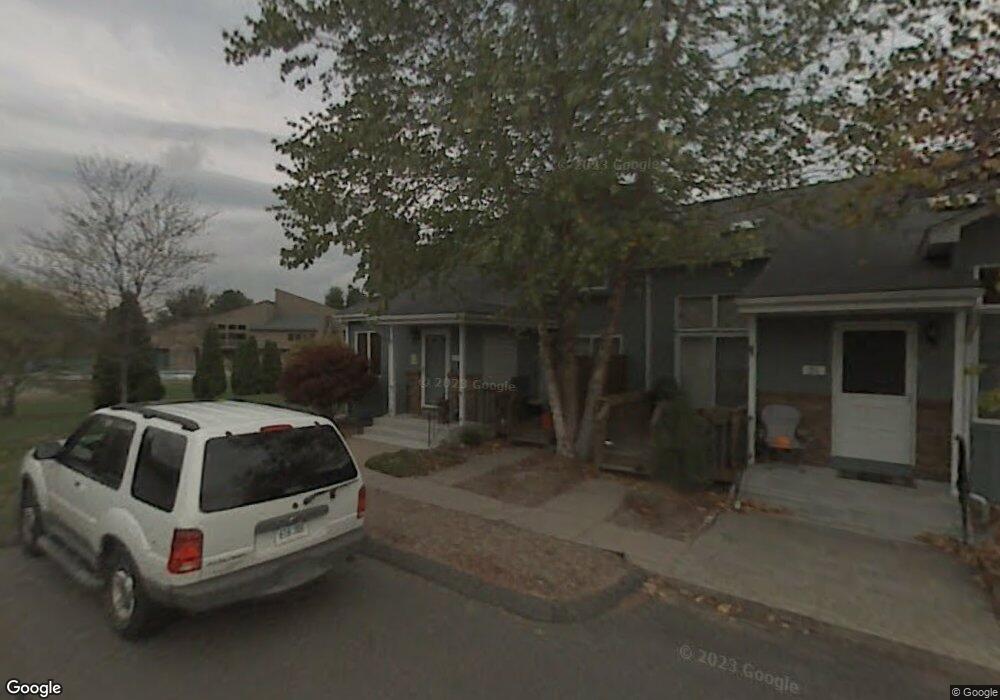
25 Ivy Ln South Windsor, CT 06074
Estimated Value: $317,984 - $343,000
2
Beds
2
Baths
1,324
Sq Ft
$249/Sq Ft
Est. Value
About This Home
This home is located at 25 Ivy Ln, South Windsor, CT 06074 and is currently estimated at $329,496, approximately $248 per square foot. 25 Ivy Ln is a home located in Hartford County with nearby schools including Timothy Edwards School, South Windsor High School, and Odyssey Community School.
Ownership History
Date
Name
Owned For
Owner Type
Purchase Details
Closed on
Sep 25, 2019
Sold by
Arc T
Bought by
Ashmaniwal Priteshkumar C and Ashmaniwal S P
Current Estimated Value
Home Financials for this Owner
Home Financials are based on the most recent Mortgage that was taken out on this home.
Original Mortgage
$132,300
Outstanding Balance
$115,131
Interest Rate
3.5%
Mortgage Type
Purchase Money Mortgage
Estimated Equity
$214,365
Purchase Details
Closed on
Feb 17, 2011
Sold by
Desmond Katherine L
Bought by
Joan Of Arc T and Steiner
Purchase Details
Closed on
Sep 3, 2003
Sold by
Briggs Phyliss
Bought by
Desmond Robert and Desmond Katherine
Home Financials for this Owner
Home Financials are based on the most recent Mortgage that was taken out on this home.
Original Mortgage
$172,900
Interest Rate
6.02%
Mortgage Type
Purchase Money Mortgage
Purchase Details
Closed on
Jul 1, 1999
Sold by
Sanford Earl
Bought by
Briggs Phyllis
Purchase Details
Closed on
Mar 18, 1997
Sold by
Lefoll Raymond
Bought by
Sanford Earl
Create a Home Valuation Report for This Property
The Home Valuation Report is an in-depth analysis detailing your home's value as well as a comparison with similar homes in the area
Home Values in the Area
Average Home Value in this Area
Purchase History
| Date | Buyer | Sale Price | Title Company |
|---|---|---|---|
| Ashmaniwal Priteshkumar C | $176,500 | -- | |
| Joan Of Arc T | $182,000 | -- | |
| Joan Of Arc T | $182,000 | -- | |
| Desmond Robert | $182,900 | -- | |
| Briggs Phyllis | $117,000 | -- | |
| Briggs Phyllis | $117,000 | -- | |
| Sanford Earl | $103,000 | -- |
Source: Public Records
Mortgage History
| Date | Status | Borrower | Loan Amount |
|---|---|---|---|
| Open | Ashmaniwal Priteshkumar C | $132,300 | |
| Previous Owner | Sanford Earl | $172,900 |
Source: Public Records
Tax History Compared to Growth
Tax History
| Year | Tax Paid | Tax Assessment Tax Assessment Total Assessment is a certain percentage of the fair market value that is determined by local assessors to be the total taxable value of land and additions on the property. | Land | Improvement |
|---|---|---|---|---|
| 2025 | $5,712 | $160,400 | $0 | $160,400 |
| 2024 | $5,527 | $160,400 | $0 | $160,400 |
| 2023 | $5,316 | $160,400 | $0 | $160,400 |
| 2022 | $4,598 | $118,600 | $0 | $118,600 |
| 2021 | $4,490 | $118,600 | $0 | $118,600 |
| 2020 | $4,493 | $118,600 | $0 | $118,600 |
| 2019 | $4,566 | $118,600 | $0 | $118,600 |
| 2018 | $4,468 | $118,600 | $0 | $118,600 |
| 2017 | $4,771 | $125,300 | $0 | $125,300 |
| 2016 | $4,679 | $125,300 | $0 | $125,300 |
| 2015 | $4,578 | $125,300 | $0 | $125,300 |
| 2014 | $4,449 | $125,300 | $0 | $125,300 |
Source: Public Records
Map
Nearby Homes
- 5 Foncine Ln Unit 5
- 949 Pleasant Valley Condo Rd Unit 10-06
- 169 Croft Dr
- 949 Pleasant Valley Rd Unit 10-07
- 25 Stonehaven Cir
- 643 Burnham St W
- 260 Smith St
- 274 Smith St
- 610 Clark St
- 2201 Mill Pond Dr Unit 2201
- 130 Candlewood Dr Unit 130
- 62 Candlewood Dr Unit 62
- 509 Mill Pond Dr
- 22 Candlewood Dr Unit 22
- 24 Podunk Cir Unit 24
- 598 Pleasant Valley Rd
- 76 Syracuse Dr
- 85 Beacon Hill Rd
- 11 Saint Marc Cir O Cir
- 2 Saint Marc Cir Unit I