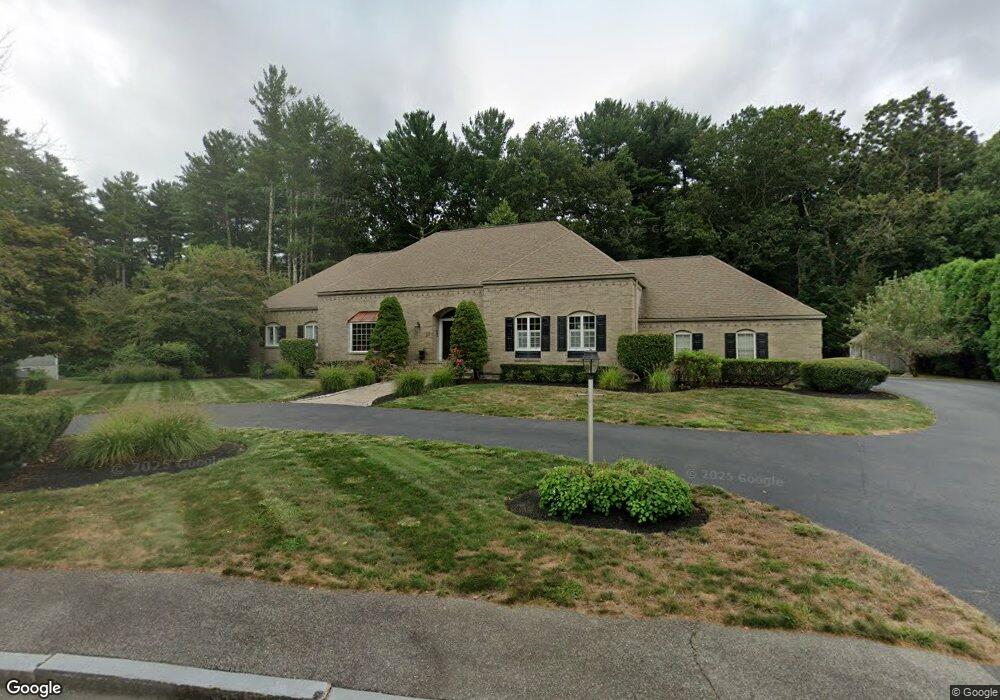
25 Jays Ln Hanover, MA 02339
Estimated Value: $1,089,000 - $1,427,000
3
Beds
3
Baths
3,834
Sq Ft
$327/Sq Ft
Est. Value
About This Home
This home is located at 25 Jays Ln, Hanover, MA 02339 and is currently estimated at $1,253,388, approximately $326 per square foot. 25 Jays Ln is a home located in Plymouth County with nearby schools including Hanover High School, Cadence Academy Preschool - Hanover, and The Master's Academy.
Ownership History
Date
Name
Owned For
Owner Type
Purchase Details
Closed on
Jun 23, 2005
Sold by
Johnson Mark F and Johnson Devota A
Bought by
Rizzo Joseph E and Rizzo Danielle J
Current Estimated Value
Home Financials for this Owner
Home Financials are based on the most recent Mortgage that was taken out on this home.
Original Mortgage
$350,000
Interest Rate
5.82%
Mortgage Type
Purchase Money Mortgage
Purchase Details
Closed on
Sep 6, 2002
Sold by
Abel John R and Abel Grace
Bought by
Johnson Mark F and Johnson Devota A
Purchase Details
Closed on
Sep 30, 1994
Sold by
Coon James H and Coon Gloria M
Bought by
Abel John R and Abel Grace K
Create a Home Valuation Report for This Property
The Home Valuation Report is an in-depth analysis detailing your home's value as well as a comparison with similar homes in the area
Home Values in the Area
Average Home Value in this Area
Purchase History
| Date | Buyer | Sale Price | Title Company |
|---|---|---|---|
| Rizzo Joseph E | $750,000 | -- | |
| Rizzo Joseph E | $750,000 | -- | |
| Johnson Mark F | $659,900 | -- | |
| Johnson Mark F | $659,900 | -- | |
| Abel John R | $388,000 | -- | |
| Abel John R | $388,000 | -- |
Source: Public Records
Mortgage History
| Date | Status | Borrower | Loan Amount |
|---|---|---|---|
| Open | Abel John R | $231,000 | |
| Closed | Abel John R | $350,000 |
Source: Public Records
Tax History Compared to Growth
Tax History
| Year | Tax Paid | Tax Assessment Tax Assessment Total Assessment is a certain percentage of the fair market value that is determined by local assessors to be the total taxable value of land and additions on the property. | Land | Improvement |
|---|---|---|---|---|
| 2025 | $13,665 | $1,106,500 | $337,400 | $769,100 |
| 2024 | $14,207 | $1,106,500 | $337,400 | $769,100 |
| 2023 | $13,672 | $1,013,500 | $306,700 | $706,800 |
| 2022 | $14,215 | $932,100 | $269,900 | $662,200 |
| 2021 | $14,344 | $878,400 | $245,300 | $633,100 |
| 2020 | $12,906 | $791,300 | $245,300 | $546,000 |
| 2019 | $13,827 | $842,600 | $267,600 | $575,000 |
| 2018 | $12,194 | $749,000 | $267,600 | $481,400 |
| 2017 | $11,425 | $691,600 | $271,700 | $419,900 |
| 2016 | $11,246 | $667,000 | $247,100 | $419,900 |
| 2015 | $10,422 | $645,300 | $247,100 | $398,200 |
Source: Public Records
Map
Nearby Homes
- 265 Silver St
- 14 Longwood Ln Unit 14
- 62 Larchmont Ln
- 53 Chestnut St
- 250 Center St
- 51 Cervelli Farm Dr
- 37 Dr
- 23 Cervelli Farm Dr
- 38 Cervelli Farm Dr
- 9 Cervelli Farm Dr
- 8 Old Farm Rd
- 276 Woodland Dr
- 436 Center St
- 186 Elm St
- 26 Church St
- 114 Graham Hill Dr
- 180 Elm St
- 20 Meadow Brook Rd
- 107 Wildcat Ln
- 118 Bates Way