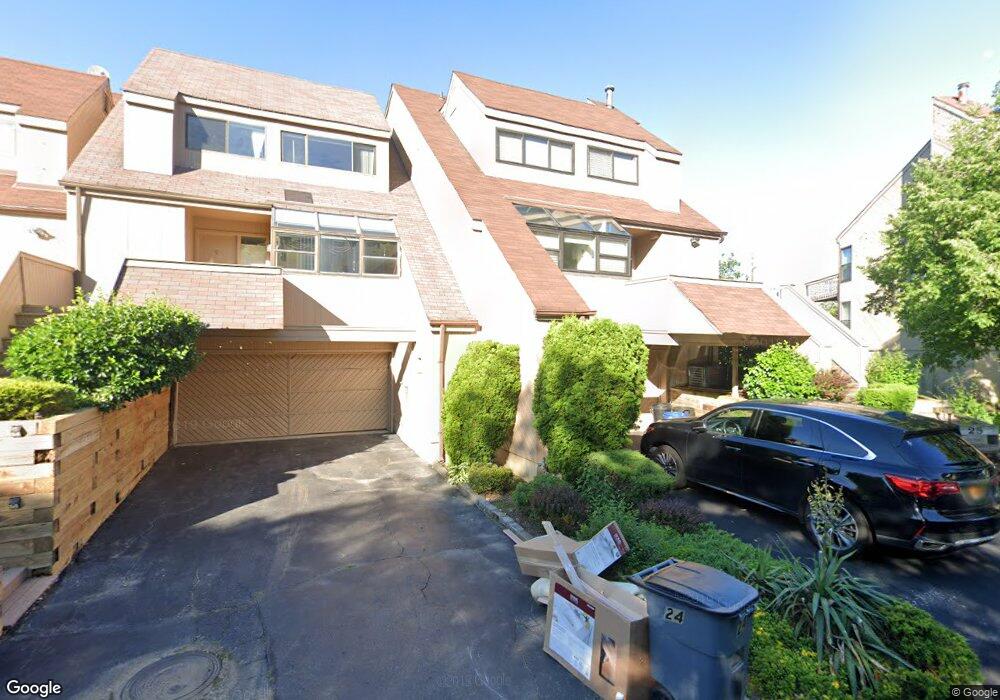
25 John Bean Ct Port Washington, NY 11050
Flower Hill NeighborhoodEstimated Value: $894,000
--
Bed
3
Baths
2,463
Sq Ft
$363/Sq Ft
Est. Value
About This Home
This home is located at 25 John Bean Ct, Port Washington, NY 11050 and is currently estimated at $894,000, approximately $362 per square foot. 25 John Bean Ct is a home located in Nassau County with nearby schools including Roslyn Middle School, Roslyn High School, and St Mary's Elementary School.
Ownership History
Date
Name
Owned For
Owner Type
Purchase Details
Closed on
May 5, 2016
Sold by
Baik Mee Ah
Bought by
Baik Meeah and Baik Kwang Chin
Current Estimated Value
Home Financials for this Owner
Home Financials are based on the most recent Mortgage that was taken out on this home.
Original Mortgage
$95,265
Interest Rate
3.59%
Mortgage Type
New Conventional
Purchase Details
Closed on
Jan 26, 2004
Sold by
Korean Air Lines Co Ltd
Bought by
Baik Mee
Create a Home Valuation Report for This Property
The Home Valuation Report is an in-depth analysis detailing your home's value as well as a comparison with similar homes in the area
Home Values in the Area
Average Home Value in this Area
Purchase History
| Date | Buyer | Sale Price | Title Company |
|---|---|---|---|
| Baik Meeah | -- | First American Title Insuran | |
| Baik Mee | $530,000 | -- |
Source: Public Records
Mortgage History
| Date | Status | Borrower | Loan Amount |
|---|---|---|---|
| Previous Owner | Baik Meeah | $95,265 |
Source: Public Records
Tax History Compared to Growth
Tax History
| Year | Tax Paid | Tax Assessment Tax Assessment Total Assessment is a certain percentage of the fair market value that is determined by local assessors to be the total taxable value of land and additions on the property. | Land | Improvement |
|---|---|---|---|---|
| 2025 | $15,106 | $650 | $271 | $379 |
| 2024 | $3,365 | $675 | $281 | $394 |
| 2023 | $14,485 | $675 | $281 | $394 |
| 2022 | $14,485 | $675 | $281 | $394 |
| 2021 | $13,972 | $688 | $287 | $401 |
| 2020 | $14,408 | $966 | $685 | $281 |
| 2019 | $13,761 | $1,035 | $734 | $301 |
| 2018 | $13,955 | $1,200 | $0 | $0 |
| 2017 | $11,924 | $1,200 | $851 | $349 |
| 2016 | $15,096 | $1,200 | $851 | $349 |
| 2015 | $3,022 | $1,200 | $801 | $399 |
| 2014 | $3,022 | $1,200 | $801 | $399 |
| 2013 | $2,900 | $1,200 | $801 | $399 |
Source: Public Records
Map
Nearby Homes