25 Johnstons Place Unit 1128 Dallas, GA 30132
East Paulding County NeighborhoodEstimated Value: $306,000 - $331,000
4
Beds
2
Baths
1,394
Sq Ft
$231/Sq Ft
Est. Value
About This Home
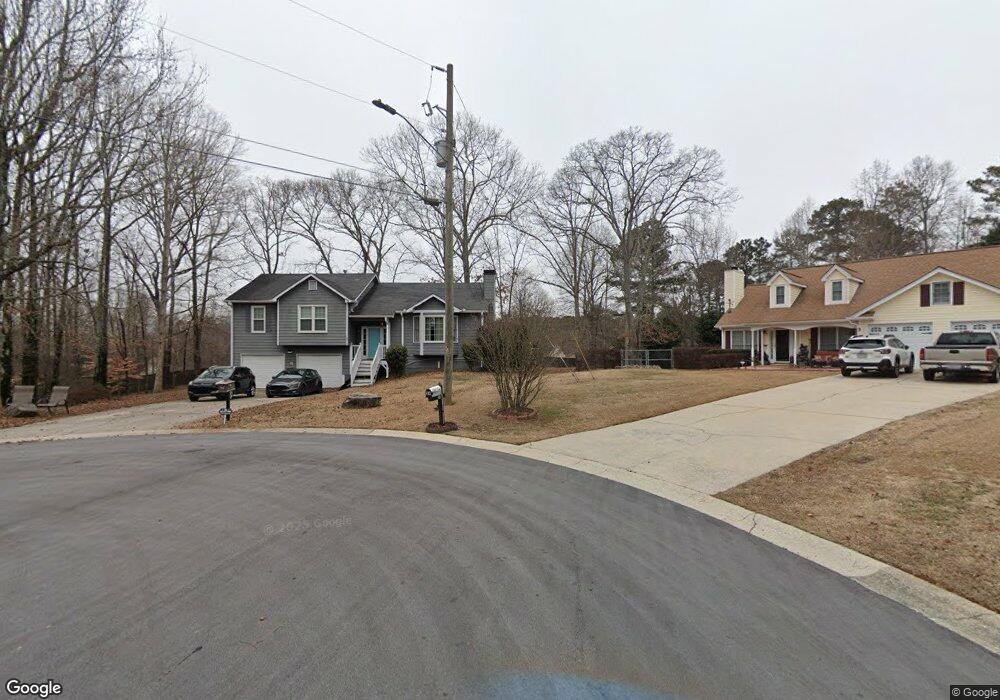
This home is located at 25 Johnstons Place Unit 1128, Dallas, GA 30132 and is currently estimated at $322,576, approximately $231 per square foot. 25 Johnstons Place Unit 1128 is a home located in Paulding County with nearby schools including W.C. Abney Elementary School, Lena Mae Moses Middle School, and East Paulding High School.
Ownership History
Date
Name
Owned For
Owner Type
Purchase Details
Closed on
Jun 25, 2018
Sold by
Brassell Robert Lee
Bought by
Hopkins Alec Bailey and Hopkins Shatequa Hartley
Current Estimated Value
Home Financials for this Owner
Home Financials are based on the most recent Mortgage that was taken out on this home.
Original Mortgage
$168,547
Outstanding Balance
$146,394
Interest Rate
4.6%
Mortgage Type
VA
Estimated Equity
$176,182
Purchase Details
Closed on
Aug 30, 2004
Sold by
Mcfalls Kenneth S and Mcfalls Caroline
Bought by
Brassell Robert L
Home Financials for this Owner
Home Financials are based on the most recent Mortgage that was taken out on this home.
Original Mortgage
$25,740
Interest Rate
5.91%
Mortgage Type
Unknown
Create a Home Valuation Report for This Property
The Home Valuation Report is an in-depth analysis detailing your home's value as well as a comparison with similar homes in the area
Home Values in the Area
Average Home Value in this Area
Purchase History
| Date | Buyer | Sale Price | Title Company |
|---|---|---|---|
| Hopkins Alec Bailey | $165,000 | -- | |
| Brassell Robert L | $128,700 | -- |
Source: Public Records
Mortgage History
| Date | Status | Borrower | Loan Amount |
|---|---|---|---|
| Open | Hopkins Alec Bailey | $168,547 | |
| Previous Owner | Brassell Robert L | $25,740 | |
| Previous Owner | Brassell Robert L | $102,960 |
Source: Public Records
Tax History Compared to Growth
Tax History
| Year | Tax Paid | Tax Assessment Tax Assessment Total Assessment is a certain percentage of the fair market value that is determined by local assessors to be the total taxable value of land and additions on the property. | Land | Improvement |
|---|---|---|---|---|
| 2024 | $2,855 | $118,020 | $12,000 | $106,020 |
| 2023 | $3,135 | $122,780 | $12,000 | $110,780 |
| 2022 | $3,061 | $103,048 | $12,000 | $91,048 |
| 2021 | $2,486 | $83,716 | $10,000 | $73,716 |
| 2020 | $2,254 | $75,896 | $10,000 | $65,896 |
| 2019 | $2,112 | $70,112 | $10,000 | $60,112 |
| 2018 | $1,748 | $59,880 | $10,000 | $49,880 |
| 2017 | $1,527 | $51,836 | $10,000 | $41,836 |
| 2016 | $1,540 | $52,802 | $10,000 | $42,802 |
| 2015 | $1,503 | $50,682 | $10,000 | $40,682 |
| 2014 | $1,393 | $46,003 | $10,000 | $36,003 |
| 2013 | -- | $39,360 | $10,000 | $29,360 |
Source: Public Records
Map
Nearby Homes
- 25 Johnstons Place
- 24 Johnstons Place
- 72 Stevenson Trail
- 92 Stevenson Trail
- 112 Johnstons Way
- 0 Stevenson Trail Unit 8682144
- 0 Stevenson Trail Unit 8619221
- 0 Stevenson Trail Unit 8115046
- 0 Stevenson Trail Unit 8762215
- 0 Stevenson Trail Unit 7054879
- 0 Stevenson Trail Unit 3237120
- 0 Stevenson Trail Unit 3270352
- 0 Stevenson Trail Unit 7267354
- 112 Stevenson Trail
- 124 Johnstons Way
- 250 Stevenson Trail
- 2135 Stevenson Trail
- 150 Johnstons Way
- 134 Stevenson Trail