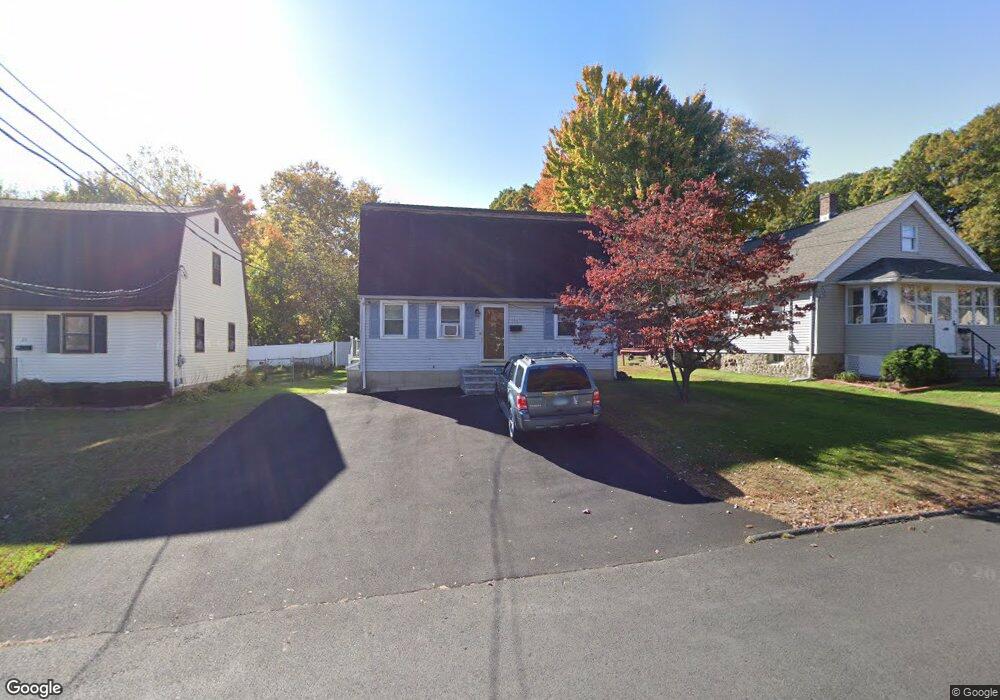
25 Judson Ave Bristol, CT 06010
South Bristol NeighborhoodEstimated Value: $299,000 - $354,000
4
Beds
2
Baths
1,560
Sq Ft
$210/Sq Ft
Est. Value
About This Home
This home is located at 25 Judson Ave, Bristol, CT 06010 and is currently estimated at $327,932, approximately $210 per square foot. 25 Judson Ave is a home located in Hartford County with nearby schools including Chippens Hill Middle School, Bristol Central High School, and Immanuel Lutheran School.
Ownership History
Date
Name
Owned For
Owner Type
Purchase Details
Closed on
Nov 21, 2003
Sold by
Bengston Joseph W and Bengston Annette J
Bought by
Wolf Roger D and Wolf Aline Mm
Current Estimated Value
Purchase Details
Closed on
Mar 11, 1988
Sold by
Clauss Glenn A
Bought by
Bengston Joseph W
Create a Home Valuation Report for This Property
The Home Valuation Report is an in-depth analysis detailing your home's value as well as a comparison with similar homes in the area
Home Values in the Area
Average Home Value in this Area
Purchase History
| Date | Buyer | Sale Price | Title Company |
|---|---|---|---|
| Wolf Roger D | $154,000 | -- | |
| Bengston Joseph W | $144,900 | -- |
Source: Public Records
Mortgage History
| Date | Status | Borrower | Loan Amount |
|---|---|---|---|
| Open | Bengston Joseph W | $241,121 | |
| Closed | Bengston Joseph W | $189,561 | |
| Closed | Bengston Joseph W | $186,760 |
Source: Public Records
Tax History
| Year | Tax Paid | Tax Assessment Tax Assessment Total Assessment is a certain percentage of the fair market value that is determined by local assessors to be the total taxable value of land and additions on the property. | Land | Improvement |
|---|---|---|---|---|
| 2025 | $5,469 | $162,050 | $30,590 | $131,460 |
| 2024 | $5,161 | $162,050 | $30,590 | $131,460 |
| 2023 | $4,918 | $162,050 | $30,590 | $131,460 |
| 2022 | $4,319 | $112,630 | $23,170 | $89,460 |
| 2021 | $4,319 | $112,630 | $23,170 | $89,460 |
| 2020 | $4,319 | $112,630 | $23,170 | $89,460 |
| 2019 | $4,286 | $112,630 | $23,170 | $89,460 |
| 2018 | $4,154 | $112,630 | $23,170 | $89,460 |
| 2017 | $4,048 | $112,350 | $33,110 | $79,240 |
| 2016 | $4,048 | $112,350 | $33,110 | $79,240 |
| 2015 | $3,888 | $112,350 | $33,110 | $79,240 |
| 2014 | $3,888 | $112,350 | $33,110 | $79,240 |
Source: Public Records
Map
Nearby Homes
Your Personal Tour Guide
Ask me questions while you tour the home.