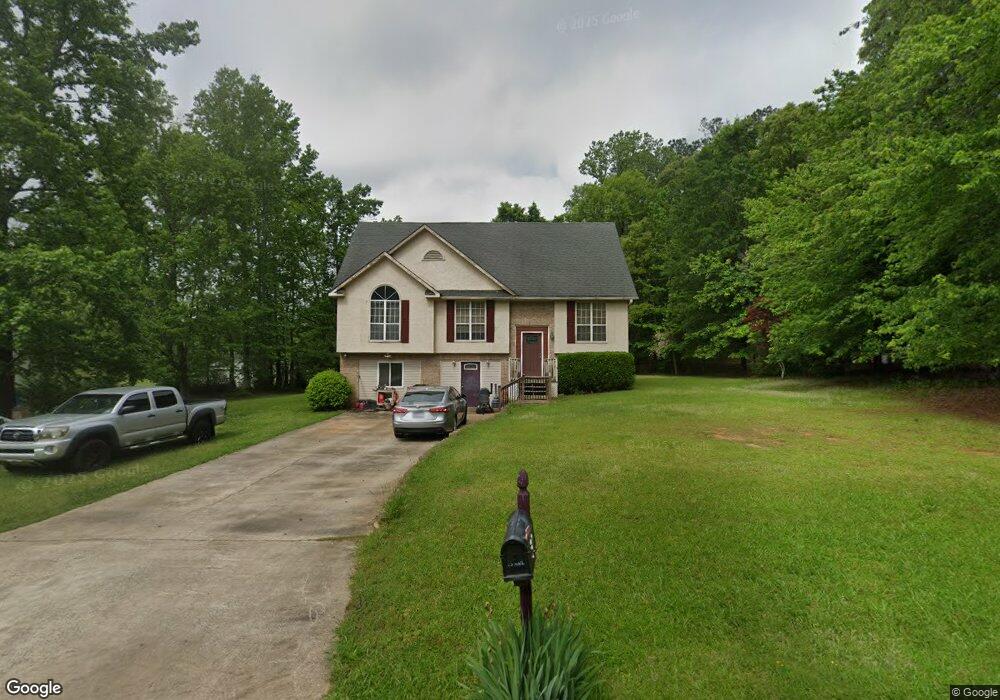
25 Kelsey Way Palmetto, GA 30268
Estimated Value: $300,419 - $349,000
3
Beds
3
Baths
1,616
Sq Ft
$197/Sq Ft
Est. Value
About This Home
This home is located at 25 Kelsey Way, Palmetto, GA 30268 and is currently estimated at $317,605, approximately $196 per square foot. 25 Kelsey Way is a home located in Coweta County with nearby schools including Brooks Elementary School, Madras Middle School, and Northgate High School.
Ownership History
Date
Name
Owned For
Owner Type
Purchase Details
Closed on
Sep 19, 2002
Sold by
Brinkman-Riley Belinda
Bought by
Riley James A
Current Estimated Value
Home Financials for this Owner
Home Financials are based on the most recent Mortgage that was taken out on this home.
Original Mortgage
$84,800
Outstanding Balance
$35,241
Interest Rate
6.3%
Mortgage Type
New Conventional
Estimated Equity
$282,364
Purchase Details
Closed on
Dec 30, 1997
Sold by
Goodard Kenneth L
Bought by
Brinkman Belinda and Dailey Debra M
Home Financials for this Owner
Home Financials are based on the most recent Mortgage that was taken out on this home.
Original Mortgage
$88,800
Interest Rate
7.2%
Mortgage Type
New Conventional
Purchase Details
Closed on
Apr 15, 1992
Bought by
Goddard Kenneth L
Purchase Details
Closed on
Jul 5, 1991
Bought by
Byrd Joseph H
Purchase Details
Closed on
Sep 7, 1990
Bought by
Byrd Harold W
Create a Home Valuation Report for This Property
The Home Valuation Report is an in-depth analysis detailing your home's value as well as a comparison with similar homes in the area
Home Values in the Area
Average Home Value in this Area
Purchase History
| Date | Buyer | Sale Price | Title Company |
|---|---|---|---|
| Riley James A | -- | -- | |
| Brinkman-Riley Bleninda | -- | -- | |
| Brinkman Belinda | $93,500 | -- | |
| Goddard Kenneth L | $85,300 | -- | |
| Byrd Joseph H | $12,000 | -- | |
| Byrd Harold W | -- | -- | |
| Mccarter John M | $134,700 | -- |
Source: Public Records
Mortgage History
| Date | Status | Borrower | Loan Amount |
|---|---|---|---|
| Open | Brinkman-Riley Bleninda | $84,800 | |
| Previous Owner | Brinkman Belinda | $88,800 |
Source: Public Records
Tax History Compared to Growth
Tax History
| Year | Tax Paid | Tax Assessment Tax Assessment Total Assessment is a certain percentage of the fair market value that is determined by local assessors to be the total taxable value of land and additions on the property. | Land | Improvement |
|---|---|---|---|---|
| 2025 | $751 | $102,766 | $12,000 | $90,766 |
| 2024 | $679 | $96,714 | $12,000 | $84,714 |
| 2023 | $679 | $94,710 | $12,000 | $82,710 |
| 2022 | $523 | $70,332 | $12,000 | $58,332 |
| 2021 | $483 | $62,285 | $12,000 | $50,285 |
| 2020 | $483 | $62,285 | $12,000 | $50,285 |
| 2019 | $349 | $42,335 | $8,000 | $34,335 |
| 2018 | $351 | $42,335 | $8,000 | $34,335 |
| 2017 | $351 | $42,335 | $8,000 | $34,335 |
| 2016 | $340 | $42,335 | $8,000 | $34,335 |
| 2015 | $266 | $36,661 | $8,000 | $28,661 |
| 2014 | $313 | $36,661 | $8,000 | $28,661 |
Source: Public Records
Map
Nearby Homes
- 45 Kelsey Way
- 84 Creekrise Place
- 58 Creekrise Place
- 1841 Tommy Lee Cook Rd
- 98 Gosdin Rd
- 138 Matthew Ct
- 1368 Tommy Lee Cook Rd
- 39 Hannah Way
- 8467 Hearn Rd
- 32 Fayme Ct
- 16 Fayme Ct
- 64 Shadow Ct
- 9311 Waterworks Rd
- 242 Shell Rd
- 9311 Water Works Rd
- 8740 Atlanta Newnan Rd
- 11792 Serenbe Ln
- 11798 Serenbe Ln
- 0 Sweet Rose Ct Unit LT82M2A 10293905
- 65 Green Terrace
- 15 Kelsey Way
- 35 Kelsey Way
- 30 Kelsey Way
- 20 Kelsey Way
- 1655 Tommy Lee Cook Rd
- 1677 Tommy Lee Cook Rd
- 1639 Tommy Lee Cook Rd
- 50 Kelsey Way
- 55 Kelsey Way
- 60 Kelsey Way
- 1697 Tommy Lee Cook Rd
- 0 Kelsey Way Unit 3139382
- 0 Kelsey Way Unit LOT 16 3213699
- 0 Kelsey Way Unit LOT 16 7231108
- 0 Kelsey Way Unit 16 7492833
- 0 Kelsey Way Unit 16 8000069
- 0 Kelsey Way Unit 16 8131117
- 0 Kelsey Way Unit 9040043
- 0 Kelsey Way Unit 5258521
- 65 Kelsey Way