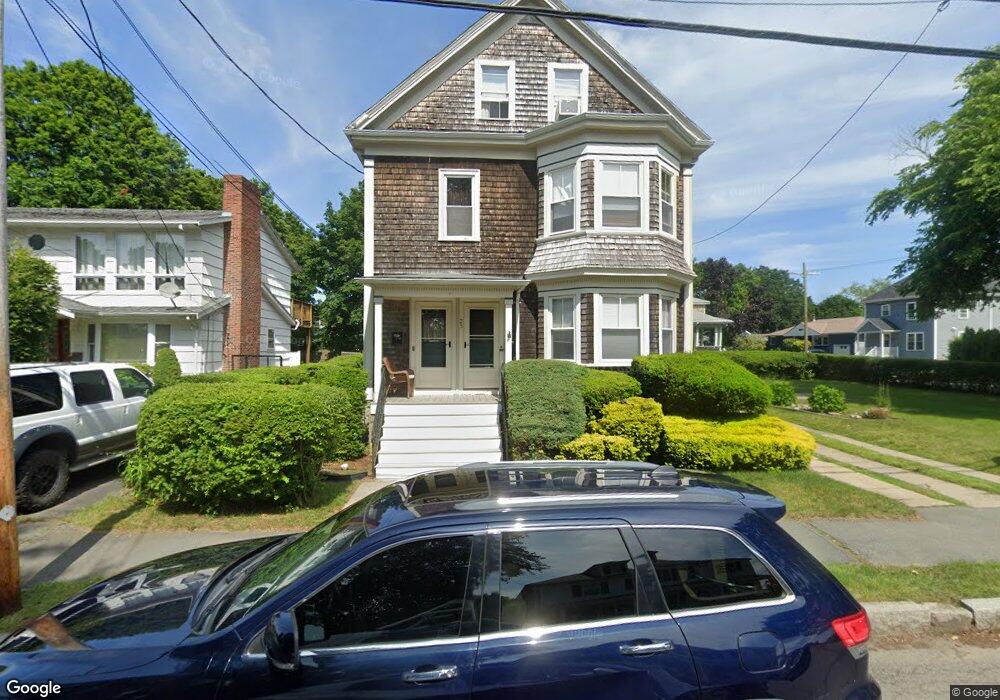
25 Laurel St Fairhaven, MA 02719
Estimated Value: $453,000 - $755,000
5
Beds
3
Baths
2,144
Sq Ft
$294/Sq Ft
Est. Value
About This Home
This home is located at 25 Laurel St, Fairhaven, MA 02719 and is currently estimated at $629,573, approximately $293 per square foot. 25 Laurel St is a home located in Bristol County with nearby schools including Fairhaven High School, City On A Hill Charter Public School New Bedford, and St. Joseph School.
Ownership History
Date
Name
Owned For
Owner Type
Purchase Details
Closed on
Feb 22, 1994
Sold by
Cerulli Dolores C and Morris Carole M
Bought by
Whittle Randall E and Whittle Gayle M
Current Estimated Value
Home Financials for this Owner
Home Financials are based on the most recent Mortgage that was taken out on this home.
Original Mortgage
$132,000
Interest Rate
7.18%
Mortgage Type
Purchase Money Mortgage
Create a Home Valuation Report for This Property
The Home Valuation Report is an in-depth analysis detailing your home's value as well as a comparison with similar homes in the area
Home Values in the Area
Average Home Value in this Area
Purchase History
| Date | Buyer | Sale Price | Title Company |
|---|---|---|---|
| Whittle Randall E | $165,000 | -- |
Source: Public Records
Mortgage History
| Date | Status | Borrower | Loan Amount |
|---|---|---|---|
| Open | Whittle Randall E | $168,000 | |
| Closed | Whittle Randall E | $158,000 | |
| Closed | Whittle Randall E | $124,000 | |
| Closed | Whittle Randall E | $132,000 |
Source: Public Records
Tax History
| Year | Tax Paid | Tax Assessment Tax Assessment Total Assessment is a certain percentage of the fair market value that is determined by local assessors to be the total taxable value of land and additions on the property. | Land | Improvement |
|---|---|---|---|---|
| 2025 | $44 | $469,600 | $184,600 | $285,000 |
| 2024 | $4,255 | $461,000 | $184,600 | $276,400 |
| 2023 | $4,229 | $425,000 | $171,100 | $253,900 |
| 2022 | $4,109 | $402,100 | $163,100 | $239,000 |
| 2021 | $3,989 | $353,300 | $148,200 | $205,100 |
| 2020 | $3,833 | $346,600 | $141,500 | $205,100 |
| 2019 | $3,968 | $340,000 | $128,800 | $211,200 |
| 2018 | $12,326 | $315,700 | $122,600 | $193,100 |
| 2017 | $3,539 | $293,900 | $122,600 | $171,300 |
| 2016 | $3,406 | $279,600 | $122,600 | $157,000 |
| 2015 | $3,328 | $273,900 | $122,600 | $151,300 |
Source: Public Records
Map
Nearby Homes
- 32 Cedar St
- 32 Green St
- 11 Lawton St
- 2 Washburn Ave
- 24 Middle St
- 58 Washington St
- 0 Nulands Neck Unit 73286360
- 8 Washington St
- 145 Pleasant St
- 78 Middle St
- 8 Manor Dr
- 39 Christian St
- 77 Adams St
- 67 Bridge St
- 181 Washington St
- 58 Bayview Ave
- 138 Main St Unit 13
- 27 Bayview Ave
- 48 Bellevue St
- 15 Bayview Ave
Your Personal Tour Guide
Ask me questions while you tour the home.