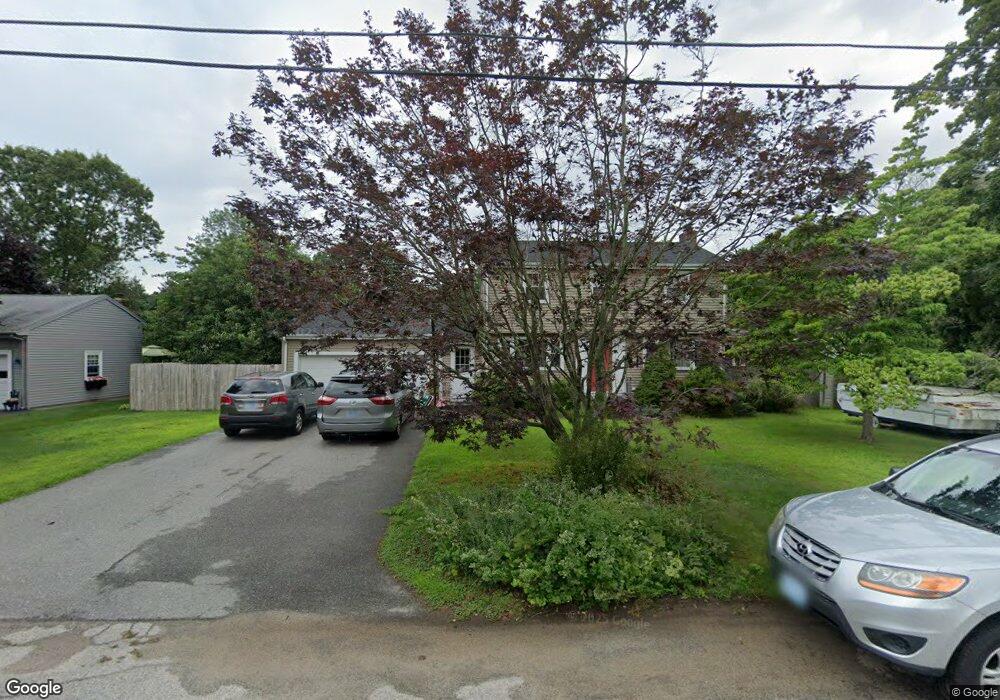
25 Ledge View Dr Cumberland, RI 02864
Diamond Hill NeighborhoodEstimated Value: $532,563 - $644,000
3
Beds
2
Baths
1,680
Sq Ft
$349/Sq Ft
Est. Value
About This Home
This home is located at 25 Ledge View Dr, Cumberland, RI 02864 and is currently estimated at $587,141, approximately $349 per square foot. 25 Ledge View Dr is a home located in Providence County with nearby schools including Community School, North Cumberland Middle School, and Cumberland High School.
Ownership History
Date
Name
Owned For
Owner Type
Purchase Details
Closed on
Jun 24, 2003
Sold by
Shanley Thomas W
Bought by
Lanci Greg C and Lanci Elise F
Current Estimated Value
Home Financials for this Owner
Home Financials are based on the most recent Mortgage that was taken out on this home.
Original Mortgage
$261,250
Interest Rate
5.71%
Mortgage Type
Purchase Money Mortgage
Purchase Details
Closed on
Jan 8, 1999
Sold by
Felici Kirk A and Felici Christine
Bought by
Shanley Thomas W
Home Financials for this Owner
Home Financials are based on the most recent Mortgage that was taken out on this home.
Original Mortgage
$142,000
Interest Rate
6.8%
Mortgage Type
Purchase Money Mortgage
Purchase Details
Closed on
Jun 30, 1997
Sold by
Weldon Jonathan D and Weldon Ellen
Bought by
Felici Kirk A and Felici Christine
Purchase Details
Closed on
Oct 3, 1994
Sold by
Manning Elaine Marie
Bought by
Weldon Jonathan D
Create a Home Valuation Report for This Property
The Home Valuation Report is an in-depth analysis detailing your home's value as well as a comparison with similar homes in the area
Home Values in the Area
Average Home Value in this Area
Purchase History
| Date | Buyer | Sale Price | Title Company |
|---|---|---|---|
| Lanci Greg C | $275,000 | -- | |
| Shanley Thomas W | $154,000 | -- | |
| Felici Kirk A | $132,500 | -- | |
| Weldon Jonathan D | $141,500 | -- |
Source: Public Records
Mortgage History
| Date | Status | Borrower | Loan Amount |
|---|---|---|---|
| Open | Weldon Jonathan D | $218,043 | |
| Closed | Weldon Jonathan D | $60,000 | |
| Closed | Weldon Jonathan D | $261,250 | |
| Previous Owner | Weldon Jonathan D | $142,000 |
Source: Public Records
Tax History
| Year | Tax Paid | Tax Assessment Tax Assessment Total Assessment is a certain percentage of the fair market value that is determined by local assessors to be the total taxable value of land and additions on the property. | Land | Improvement |
|---|---|---|---|---|
| 2025 | $4,812 | $392,200 | $154,200 | $238,000 |
| 2024 | $4,687 | $392,200 | $154,200 | $238,000 |
| 2023 | $4,557 | $392,200 | $154,200 | $238,000 |
| 2022 | $4,578 | $305,400 | $119,900 | $185,500 |
| 2021 | $4,502 | $305,400 | $119,900 | $185,500 |
| 2020 | $4,373 | $305,400 | $119,900 | $185,500 |
| 2019 | $4,364 | $274,800 | $109,000 | $165,800 |
| 2018 | $4,237 | $274,800 | $109,000 | $165,800 |
| 2017 | $4,180 | $274,800 | $109,000 | $165,800 |
| 2016 | $4,268 | $249,900 | $110,700 | $139,200 |
| 2015 | $4,268 | $249,900 | $110,700 | $139,200 |
| 2014 | $4,268 | $249,900 | $110,700 | $139,200 |
| 2013 | $4,237 | $268,500 | $112,500 | $156,000 |
Source: Public Records
Map
Nearby Homes
- 47 Austin Dr
- 14 Metcalf Dr
- 3360 Diamond Hill Rd
- 14 Longbrook Dr
- 172 Pine Swamp Rd
- 180 Pine Swamp Rd
- 56 Pine Swamp Rd
- 60 Grant Ave
- 74 Hillside Rd
- 3070 Diamond Hill Rd
- 365 W Wrentham Rd
- 4 Carnation St
- 10 Follett Dr
- 33 Old Meadow Ln
- 1620 West St
- 25 Nature View Dr
- 20 Nature View Dr
- 48 Nate Whipple Hwy
- 102 High St
- 6 New Clark Rd
- 21 Ledge View Dr
- 33 Ledge View Dr
- 15 Mount View Dr
- 17 Mount View Dr
- 27 Mount View Dr
- 4 Douglas Dr
- 35 Ledge View Dr
- 15 Ledge View Dr
- 2 Beacon Ln
- 6 Douglas Dr
- 8 Douglas Dr
- 29 Mount View Dr
- 22 Mount View Dr
- 18 Mount View Dr
- 45 Ledge View Dr
- 24 Mount View Dr
- 26 Mount View Dr
- 2 Douglas Dr
- 14 Tower Hill Rd
- 7 Beacon Ln
Your Personal Tour Guide
Ask me questions while you tour the home.