J
Seller's Agent in 2020
Joanne Prevost Anzalone
Anzalone Realty
(617) 270-4192
3 Total Sales

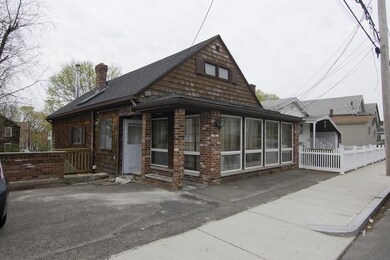


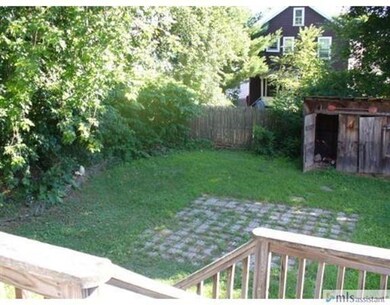

A unique “handyman's special†with lots of possibilities located on a spacious yard in a great area. 5 bedroom 2.5 bath old-style home, that needs some upgrades but has lots of potential for renovations or as a tear-down lot to build on. Kitchen has lots of counter space. There is a heated addition on the back of the home with full walk-out. Upper level has en suite with living room, bedroom, oversized deck and ½ bath. Downstairs level has 4 bedrooms and a full bath along with a laundry room. All rooms are above grade with full size windows. There is a full size unfinished basement with full walkout. Large level backyard with patio space. Winthrop by the Sea is a quiet Oceanside community minutes to Logan Airport, Downtown Boston, Major Hospitals, and Orient Heights Blue Line station. Winthrop boasts 3 yacht clubs, marinas, golf course, restaurants, and miles of beaches.
Co-Listed By
Maria Renda
True North Boston Realty LLC
Last Buyer's Agent
Brian Walker
Compass

We collect this data history from publicly available records. To have your information removed, we recommend requesting removal directly through your county’s website.
| Date | Event | Price | List to Sale | Price per Sq Ft |
|---|---|---|---|---|
| 04/01/2020 04/01/20 | Sold | $410,000 | 0.0% | $337 / Sq Ft |
| 03/31/2020 03/31/20 | Pending | -- | -- | -- |
| 01/28/2020 01/28/20 | Off Market | $410,000 | -- | -- |
| 01/07/2020 01/07/20 | For Sale | $410,000 | -- | $337 / Sq Ft |
We collect this data history from publicly available records. To have your information removed, we recommend requesting removal directly through your county’s website.
| Year | Tax Paid | Tax Assessment Tax Assessment Total Assessment is a certain percentage of the fair market value that is determined by local assessors to be the total taxable value of land and additions on the property. | Land | Improvement |
|---|---|---|---|---|
| 2024 | $9,806 | $941,100 | $325,100 | $616,000 |
| 2023 | $5,378 | $502,600 | $297,600 | $205,000 |
| 2022 | $5,201 | $442,300 | $265,800 | $176,500 |
| 2021 | $5,744 | $453,000 | $237,300 | $215,700 |
| 2020 | $5,717 | $453,000 | $237,300 | $215,700 |
| 2019 | $5,591 | $424,200 | $218,700 | $205,500 |
| 2018 | $5,425 | $383,100 | $187,800 | $195,300 |
| 2017 | $4,999 | $346,900 | $166,200 | $180,700 |
| 2016 | $4,931 | $320,800 | $144,500 | $176,300 |
| 2015 | $4,478 | $312,300 | $140,300 | $172,000 |
| 2014 | $4,485 | $287,900 | $130,500 | $157,400 |
J
Seller's Agent in 2020
Joanne Prevost Anzalone
Anzalone Realty
(617) 270-4192
3 Total Sales
M
Seller Co-Listing Agent in 2020
Maria Renda
True North Boston Realty LLC
B
Buyer's Agent in 2020
Brian Walker
Compass
Source: MLS Property Information Network (MLS PIN)
MLS Number: 72605301
APN: WINT M:062 L:073
Disclaimer: Certain information contained herein is derived from information provided by parties other than Homes.com. All information provided is deemed reliable, but is not guaranteed to be accurate and should be independently verified.
![]() The property listing data and information, or the Images, set forth herein were provided to MLS Property Information Network, Inc. from third party sources, including sellers, lessors and public records, and were compiled by MLS Property Information Network, Inc. The property listing data and information, and the Images, are for the personal, non-commercial use of consumers having a good faith interest in purchasing or leasing listed properties of the type displayed to them and may not be used for any purpose other than to identify prospective properties which such consumers may have a good faith interest in purchasing or leasing. MLS Property Information Network, Inc. and its subscribers disclaim any and all representations and warranties as to the accuracy of the property listing data and information, or as to the accuracy of any of the Images, set forth herein.
The property listing data and information, or the Images, set forth herein were provided to MLS Property Information Network, Inc. from third party sources, including sellers, lessors and public records, and were compiled by MLS Property Information Network, Inc. The property listing data and information, and the Images, are for the personal, non-commercial use of consumers having a good faith interest in purchasing or leasing listed properties of the type displayed to them and may not be used for any purpose other than to identify prospective properties which such consumers may have a good faith interest in purchasing or leasing. MLS Property Information Network, Inc. and its subscribers disclaim any and all representations and warranties as to the accuracy of the property listing data and information, or as to the accuracy of any of the Images, set forth herein.
Ask me questions while you tour the home.