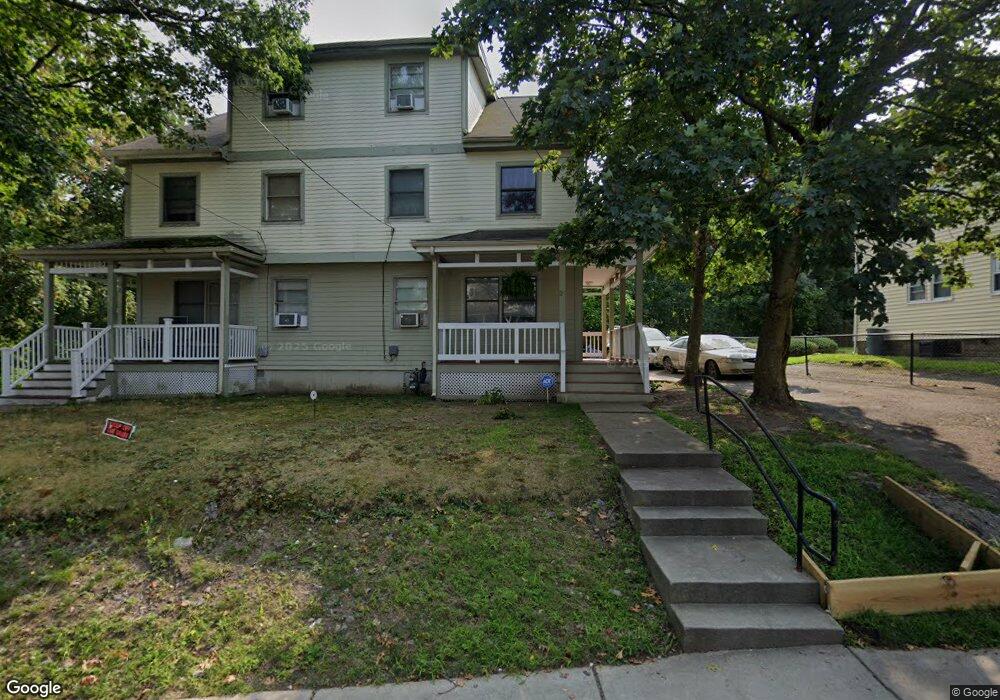
25 Logan St Roxbury, MA 02119
Fort Hill NeighborhoodEstimated Value: $437,000 - $520,472
3
Beds
2
Baths
1,100
Sq Ft
$452/Sq Ft
Est. Value
About This Home
This home is located at 25 Logan St, Roxbury, MA 02119 and is currently estimated at $497,368, approximately $452 per square foot. 25 Logan St is a home located in Suffolk County with nearby schools including City on a Hill Charter Public School and Paige Academy.
Ownership History
Date
Name
Owned For
Owner Type
Purchase Details
Closed on
Jun 29, 2005
Sold by
Ennis Highland Ue Llc
Bought by
Price Louvenia
Current Estimated Value
Home Financials for this Owner
Home Financials are based on the most recent Mortgage that was taken out on this home.
Original Mortgage
$93,000
Outstanding Balance
$48,766
Interest Rate
5.73%
Mortgage Type
Purchase Money Mortgage
Estimated Equity
$448,602
Purchase Details
Closed on
May 11, 2005
Sold by
Ennis Highland Ue Llc
Bought by
Williams Lornece
Home Financials for this Owner
Home Financials are based on the most recent Mortgage that was taken out on this home.
Original Mortgage
$93,000
Outstanding Balance
$48,766
Interest Rate
5.73%
Mortgage Type
Purchase Money Mortgage
Estimated Equity
$448,602
Create a Home Valuation Report for This Property
The Home Valuation Report is an in-depth analysis detailing your home's value as well as a comparison with similar homes in the area
Home Values in the Area
Average Home Value in this Area
Purchase History
| Date | Buyer | Sale Price | Title Company |
|---|---|---|---|
| Price Louvenia | $160,000 | -- | |
| Williams Lornece | $160,000 | -- |
Source: Public Records
Mortgage History
| Date | Status | Borrower | Loan Amount |
|---|---|---|---|
| Open | Price Louvenia | $93,000 | |
| Previous Owner | Williams Lornece | $155,200 |
Source: Public Records
Tax History Compared to Growth
Tax History
| Year | Tax Paid | Tax Assessment Tax Assessment Total Assessment is a certain percentage of the fair market value that is determined by local assessors to be the total taxable value of land and additions on the property. | Land | Improvement |
|---|---|---|---|---|
| 2025 | $4,459 | $385,100 | $99,009 | $286,091 |
| 2024 | $3,997 | $366,700 | $99,009 | $267,691 |
| 2023 | $3,750 | $349,200 | $94,284 | $254,916 |
| 2022 | $3,619 | $332,600 | $89,802 | $242,798 |
| 2021 | $3,380 | $316,800 | $0 | $316,800 |
| 2020 | $3,186 | $301,700 | $0 | $301,700 |
| 2019 | $3,028 | $287,300 | $133,900 | $153,400 |
| 2018 | $2,867 | $273,600 | $133,900 | $139,700 |
| 2017 | $2,760 | $260,600 | $133,900 | $126,700 |
| 2016 | $2,730 | $248,200 | $133,900 | $114,300 |
| 2015 | $2,863 | $236,400 | $100,300 | $136,100 |
| 2014 | $2,832 | $225,100 | $100,300 | $124,800 |
Source: Public Records
Map
Nearby Homes
- 38 Juniper St
- 31 Dorr St
- 9 W Cedar St Unit 1
- 49 Norfolk St
- 10 Linwood St
- 4 Fort Ave Unit 2
- 63 Beech Glen St
- 27 Dudley St
- 51 Saint James St
- 64 Alpine St Unit 104
- 64 Alpine St Unit 304
- 59 Fort Ave
- 37 Regent St Unit 2
- 9-45 Vale St
- 249 Roxbury St Unit 1
- 2856 Washington St
- 16 Mayfair St
- 8 Brinton St Unit 2
- 94 Walnut Ave
- 22 Rockville Park
- 21 Logan St Unit 23
- 21 Logan St Unit 1
- 27 Logan St
- 15 Logan St Unit 17
- 18 Logan St Unit 1
- 20-22 Logan St Unit 2
- 20-22 Logan St Unit 1
- 1121 Thornton St Unit 1
- 16 Logan St Unit 18
- 14 Logan St Unit 14
- 14 Logan St
- 14 Logan St Unit 1
- 14 Logan St Unit 2
- 20 Logan St Unit 22
- 9 Logan St Unit 11
- 12 Logan St Unit 14
- 12 Logan St Unit 12
- 12 Logan St Unit Logan St
- 12 Logan St
- 12 Logan St Unit 2