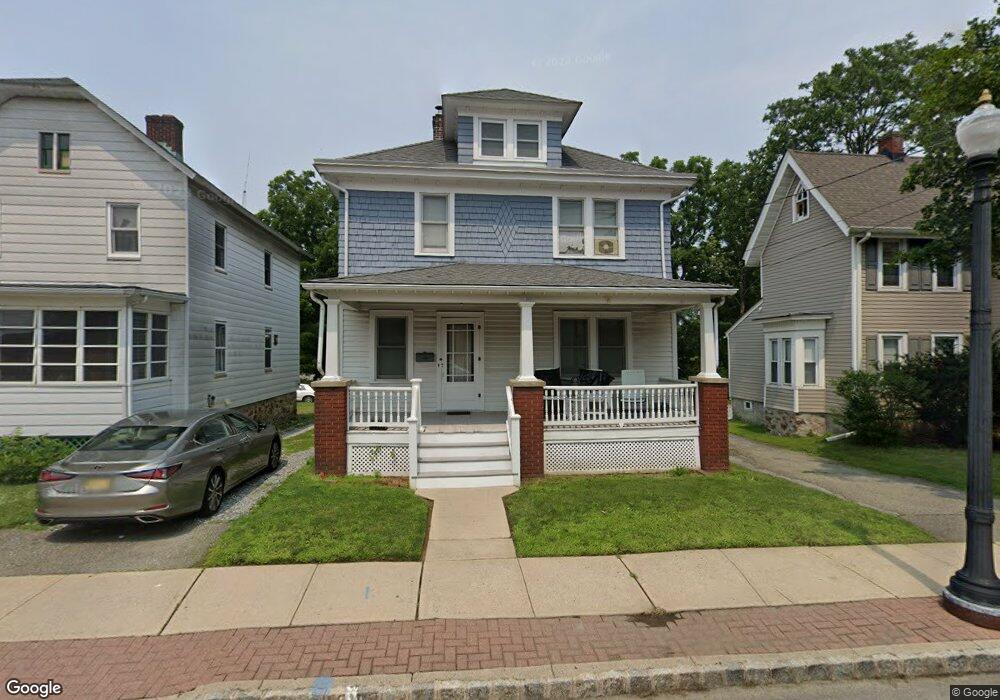
25 Main St Netcong, NJ 07857
Estimated Value: $364,000 - $441,000
Studio
--
Bath
1,528
Sq Ft
$265/Sq Ft
Est. Value
About This Home
This home is located at 25 Main St, Netcong, NJ 07857 and is currently estimated at $405,202, approximately $265 per square foot. 25 Main St is a home located in Morris County with nearby schools including Netcong Elementary School and Lenape Val Regional High School.
Ownership History
Date
Name
Owned For
Owner Type
Purchase Details
Closed on
Dec 22, 2016
Sold by
Insource East Properties Inc
Bought by
Reso Holdings Lc
Current Estimated Value
Purchase Details
Closed on
Sep 7, 2010
Sold by
Repp Barbara M and Mcelroy Barabara M
Bought by
Repp Barbara M and Repp Henry F
Purchase Details
Closed on
Aug 19, 2002
Sold by
Mcelroy Helen
Bought by
Mcelroy Barbara
Create a Home Valuation Report for This Property
The Home Valuation Report is an in-depth analysis detailing your home's value as well as a comparison with similar homes in the area
Home Values in the Area
Average Home Value in this Area
Purchase History
| Date | Buyer | Sale Price | Title Company |
|---|---|---|---|
| Reso Holdings Lc | $185,000 | Max Title Agency Llc | |
| Repp Barbara M | -- | None Available | |
| Mcelroy Barbara | -- | -- |
Source: Public Records
Tax History
| Year | Tax Paid | Tax Assessment Tax Assessment Total Assessment is a certain percentage of the fair market value that is determined by local assessors to be the total taxable value of land and additions on the property. | Land | Improvement |
|---|---|---|---|---|
| 2025 | $7,343 | $214,900 | $101,600 | $113,300 |
| 2024 | $7,408 | $214,900 | $101,600 | $113,300 |
Source: Public Records
Map
Nearby Homes
- 22 Kelly Place
- 74 Main St
- 79 Main St
- 16-18 King St
- 35 Hillside Ave
- 49 Brooklyn Rd
- 58 Silas Rd Unit G
- 4 Elizabeth Ave
- 50 Silas Rd
- 20 Barone St
- 58 Brooklyn Rd
- 7 Walton Place
- 2 Roberts Place
- 8 Hillside Ave
- 31 Highland Ave
- 0 Lawrence Ave
- 329 Alpine Ct Unit 29
- 2007A Stonegate Ln Unit 2007A
- 71 U S Highway 206
- 573 Dell Place Unit 73
- 27 Main St
- 23 Main St
- 21 Main St Unit 1
- 21 Main St
- 1 Jenny Lind St 25 Unit 35
- 36 Main St
- 1 Jenny Lind Street 16 Unit 16
- 28 Main St Unit 30
- 1 Jenny Lind St 34 Unit 34
- 1 Jenny Lind St 10 Unit 10
- 1 Jenny Lind St Unit 29 Unit 29
- 1 Jenny Lind St 27 Unit 27
- 1 Jenny Lind St Apt 4 Unit 4
- 40 Main St
- 1 Jenny Lind St Unit 5
- 1 Jenny Lind St Unit 7
- 1 Jenny Lind St
- 1 Jenny Lind St Unit 14
- 1 Jenny Lind St Unit 32
- 1 Jenny Lind St Unit 29
Your Personal Tour Guide
Ask me questions while you tour the home.