Estimated Value: $386,000 - $461,708
5
Beds
4
Baths
1,560
Sq Ft
$278/Sq Ft
Est. Value
About This Home
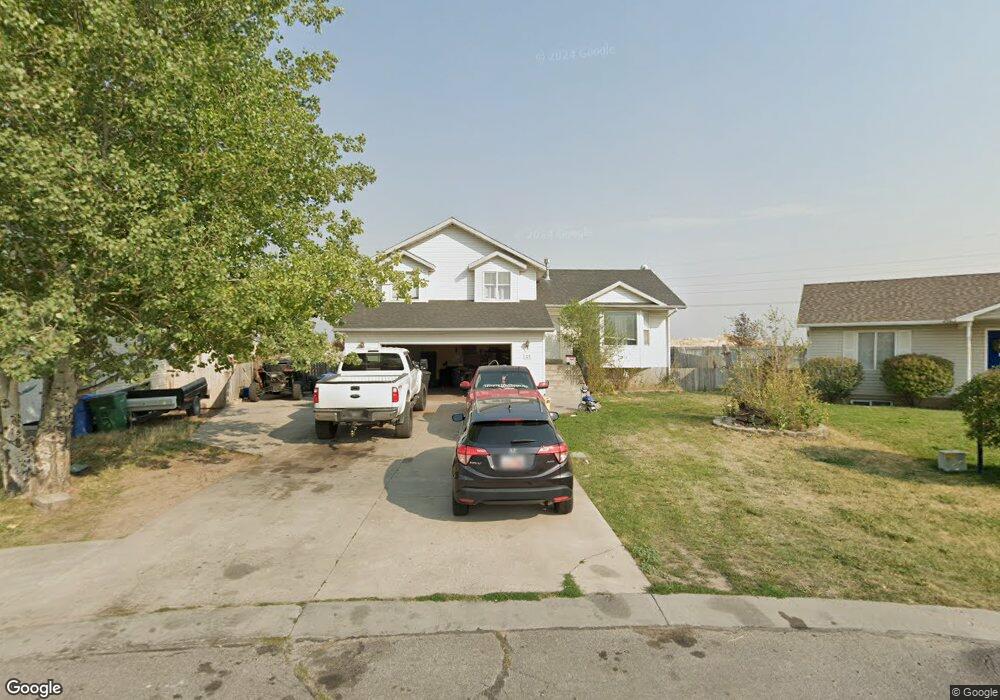
This home is located at 25 Manitoban Ln, Hyrum, UT 84319 and is currently estimated at $434,427, approximately $278 per square foot. 25 Manitoban Ln is a home located in Cache County with nearby schools including Canyon School, South Cache Middle School, and Mountain Crest High School.
Ownership History
Date
Name
Owned For
Owner Type
Purchase Details
Closed on
Feb 28, 2012
Sold by
The Secretary Of Housing & Urban Develop
Bought by
Rodriguez Francisco J
Current Estimated Value
Home Financials for this Owner
Home Financials are based on the most recent Mortgage that was taken out on this home.
Original Mortgage
$128,409
Outstanding Balance
$87,059
Interest Rate
3.75%
Mortgage Type
FHA
Estimated Equity
$347,368
Purchase Details
Closed on
Oct 31, 2011
Sold by
Wells Fargo Bank Na
Bought by
Secretary Of Housing & Urban Development
Purchase Details
Closed on
Apr 25, 2011
Sold by
Swager Jodi L
Bought by
Wells Fargo Bank Na
Purchase Details
Closed on
Jun 17, 2002
Sold by
Harmon Lyle Glen and Harmon Janette A
Bought by
Swager Jodi L
Home Financials for this Owner
Home Financials are based on the most recent Mortgage that was taken out on this home.
Original Mortgage
$131,147
Interest Rate
6.74%
Mortgage Type
FHA
Create a Home Valuation Report for This Property
The Home Valuation Report is an in-depth analysis detailing your home's value as well as a comparison with similar homes in the area
Home Values in the Area
Average Home Value in this Area
Purchase History
| Date | Buyer | Sale Price | Title Company |
|---|---|---|---|
| Rodriguez Francisco J | -- | American Secure Title Logan | |
| Secretary Of Housing & Urban Development | -- | Inwest Title Ogden | |
| Wells Fargo Bank Na | $129,032 | Etitle Insurance Agency | |
| Swager Jodi L | -- | Cache Title Company |
Source: Public Records
Mortgage History
| Date | Status | Borrower | Loan Amount |
|---|---|---|---|
| Open | Rodriguez Francisco J | $128,409 | |
| Previous Owner | Swager Jodi L | $131,147 |
Source: Public Records
Tax History Compared to Growth
Tax History
| Year | Tax Paid | Tax Assessment Tax Assessment Total Assessment is a certain percentage of the fair market value that is determined by local assessors to be the total taxable value of land and additions on the property. | Land | Improvement |
|---|---|---|---|---|
| 2025 | $1,613 | $231,600 | $0 | $0 |
| 2024 | $1,731 | $232,045 | $0 | $0 |
| 2023 | $1,542 | $197,710 | $0 | $0 |
| 2022 | $1,609 | $197,710 | $0 | $0 |
| 2021 | $1,589 | $300,780 | $66,000 | $234,780 |
| 2020 | $1,444 | $256,509 | $66,000 | $190,509 |
| 2019 | $1,382 | $230,909 | $40,400 | $190,509 |
| 2018 | $1,276 | $206,060 | $40,400 | $165,660 |
| 2017 | $1,253 | $105,050 | $0 | $0 |
| 2016 | $1,282 | $91,300 | $0 | $0 |
| 2015 | $1,023 | $83,670 | $0 | $0 |
| 2014 | $1,001 | $83,670 | $0 | $0 |
| 2013 | -- | $83,670 | $0 | $0 |
Source: Public Records
Map
Nearby Homes
- 13 Manitoban Ln
- 37 Manitoban Ln
- 13 S 1100 E
- 1109 Rocky Mountain Way
- 1109 Rocky Mountain Way
- 1105 E 30 S
- 49 Manitoban Ln
- 18 Manitoban Ln
- 6 Manitoban Ln
- 30 Manitoban Ln
- 61 Manitoban Ln
- 1108 Rocky Mountain Way
- 12 S 1100 E
- 42 Manitoban Ln
- 1112 E 30 S
- 1117 Rocky Mountain Way
- 1093 E 30 S
- 1104 E 30 S
- 54 Manitoban Ln
- 73 Manitoban Ln